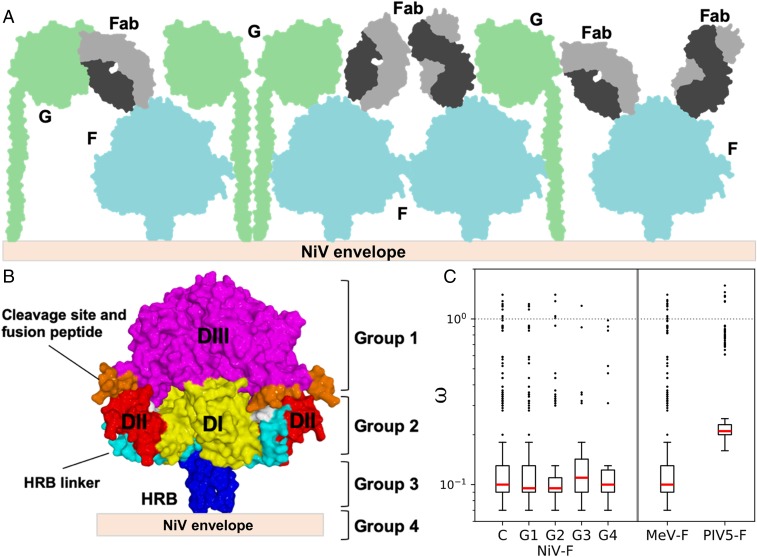
Fig. 5.
A model for immune accessible areas on NiV-F. (A) Schematic of the NiV surface, where NiV-F (blue) and NiV-G (green) associate and densely populate the viral envelope. Fabs (gray) are shown contacting potential immune accessible, membrane distal regions of NiV-F. (B) Diagram showing the functional domains of the NiV-F protein and the assignment of groups for the dN/dS analysis. Groups were assigned based on functional domain and distance from the viral membrane. Group 1: DIII; group 2: DI, DII, and the HRB linker; group 3: HRB; and group 4: TM domain. (C) Comparison of the ω estimates (y axis) across the complete fusion protein (termed “C”) of 3 paramyxoviruses (NiV-F, MeV-F, and PIV5-F), and across different functional groups of the NiV-F (G1 to G4, as defined in B). No evidence for positive diversifying selection was detected for any region of the different paramyxoviral F proteins analyzed, as all mean estimates fall below the threshold of ω > 1 (represented by the dotted line at 100). The red lines represent the median values, the ends of each box represent the 75% confidence intervals, and the whiskers represent the 95% CIs. The outliers are values that lie beyond the 95% CIs and are represented by circles (see SI Appendix, Table S3).

