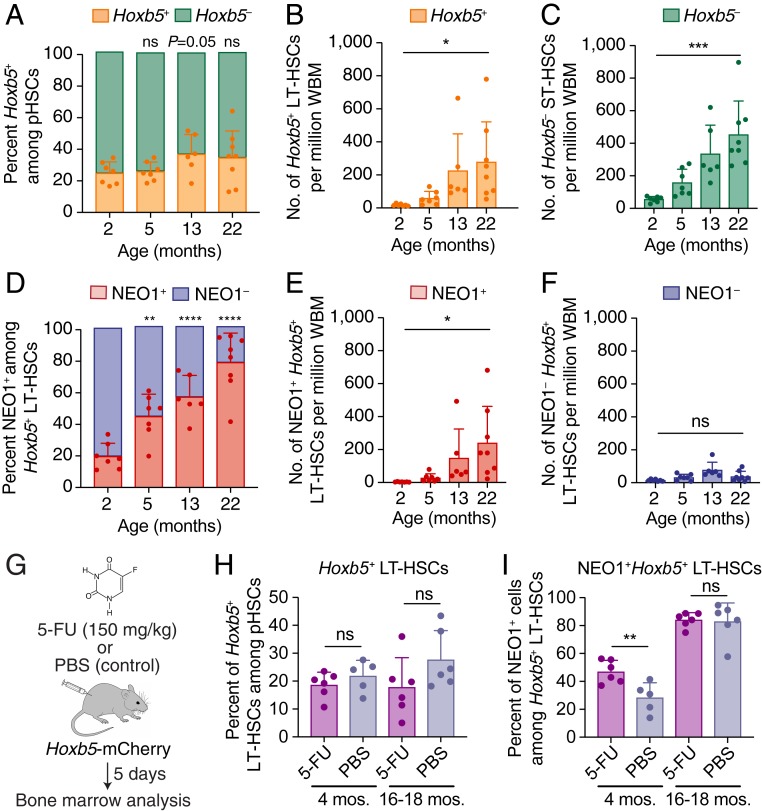
Fig. 2.
NEO1+Hoxb5+ LT-HSCs selectively expand during aging and respond to myeloablative stress in young mice. (A–C) Frequency and number of Hoxb5+ LT-HSCs and Hoxb5− ST-HSCs at 2 (n = 7 mice), 5 (n = 7 mice), 13 (n = 6 mice), and 22 (n = 9 mice) months of age. (A) Percent of cells among pHSCs that are Hoxb5+ (orange) and Hoxb5− (green). Statistical significance was calculated using an unpaired, 2-tailed Student’s t test between 2 mo and each time point. ns, nonsignificant; P ≥ 0.05. (B) Number of Hoxb5+ LT-HSCs per million WBM cells. Statistical significance was calculated using an unpaired, 2-tailed Student’s t test between 2 mo and 22 mo of age. *P < 0.05. (C) Number of Hoxb5− ST-HSCs per million WBM cells. Statistical significance was calculated using an unpaired, 2-tailed Student’s t test between 2 mo and 22 mo of age. ***P < 0.001. (D–F) Frequency and number of NEO1+ and NEO1−Hoxb5+ LT-HSCs at 2 (n = 7 mice), 5 (n = 7 mice), 13 (n = 6 mice), and 22 (n = 9 mice) months of age. (D) Percent of cells among Hoxb5+ LT-HSCs that are NEO1+ (red) and NEO1− (blue). Statistical significance was calculated using an unpaired, 2-tailed Student’s t test between 2 mo and each time point. ***P < 0.001, ****P < 0.0001 (E) Number of NEO1+ Hoxb5+ LT-HSCs per million WBM cells. Statistical significance was calculated using an unpaired, 2-tailed Student’s t test between 2 mo and 22 mo of age. *P < 0.05. (F) Number of NEO1−Hoxb5+ LT-HSCs per million WBM cells. Statistical significance was calculated using an unpaired, 2-tailed Student’s t test between 2 mo and 22 mo of age. ns, nonsignificant; P ≥ 0.05. (G–I) Response of HSC subpopulations from 4-mo-old (n = 5 to 6 mice) and 16- to 18-mo-old (n = 6 mice) Hoxb5-mCherry mice 5 d after treatment with 5-fluoruracil (5-FU). (G) Experimental design of myeloablative stress with 5-FU or PBS control. (H) Frequency of Hoxb5+ LT-HSCs among all pHSCs after 5-FU or PBS injection at different ages. (I) Frequency of NEO1+Hoxb5+ LT-HSCs among all Hoxb5+ LT-HSCs after 5-FU or PBS injection at different ages. Statistical significance was calculated using an unpaired, 2-tailed Student’s t test. ns, nonsignificant or P ≥ 0.05; **P < 0.01. All bar plots in this figure indicate mean ± SD. mos., months.

