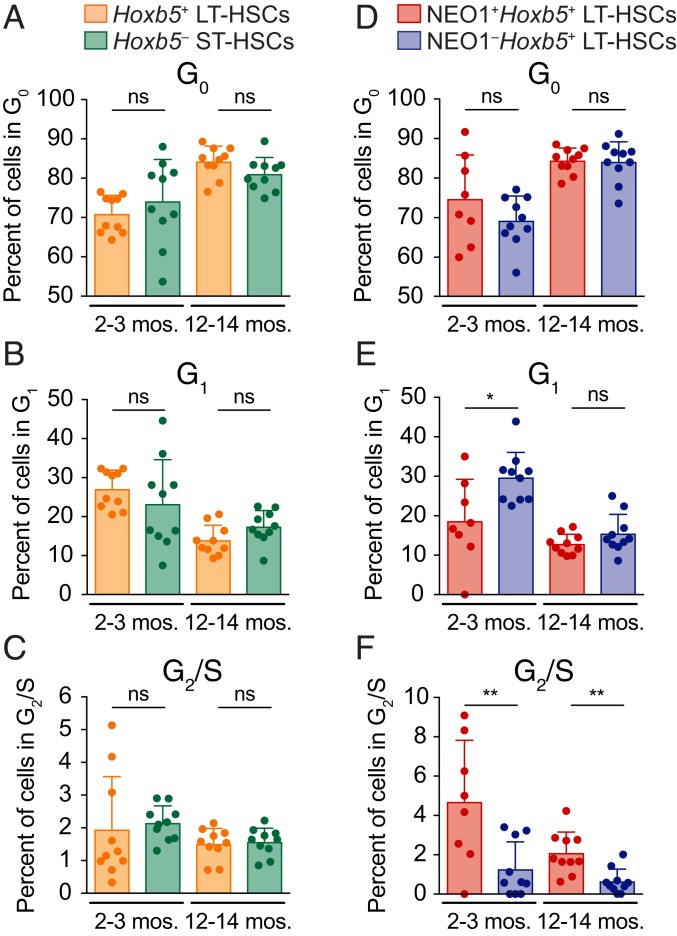
Fig. 3.
NEO1 marks a more proliferative fraction of LT-HSCs. (A–F) Cell cycle analysis of 2- to 3-mo-old (n = 10 mice) and 12- to 14-mo-old (n = 10 mice) LT-HSC fractions with KI-67 and DAPI staining. mos., months. (A–C) Percent of Hoxb5+ LT-HSCs or Hoxb5− ST-HSCs in (A) G0, (B) G1, and (C) G2/S in 2- to 3-mo-old and 12- to 14-mo-old mouse bone marrow. Statistical significance was calculated using an unpaired, 2-tailed Student’s t test. ns, nonsignificant; P ≥ 0.05. (D–F) Percent of NEO1+ or NEO1− Hoxb5+ LT-HSCs in (D) G0, (E) G1, and (F) G2/S in 2- to 3-mo-old and 12- to 14-mo-old mouse bone marrow. Statistical significance was calculated using an unpaired, 2-tailed Student’s t test. ns, nonsignificant; P ≥ 0.05, *P < 0.05, **P < 0.01. All bar plots in this figure indicate mean ± SD.

