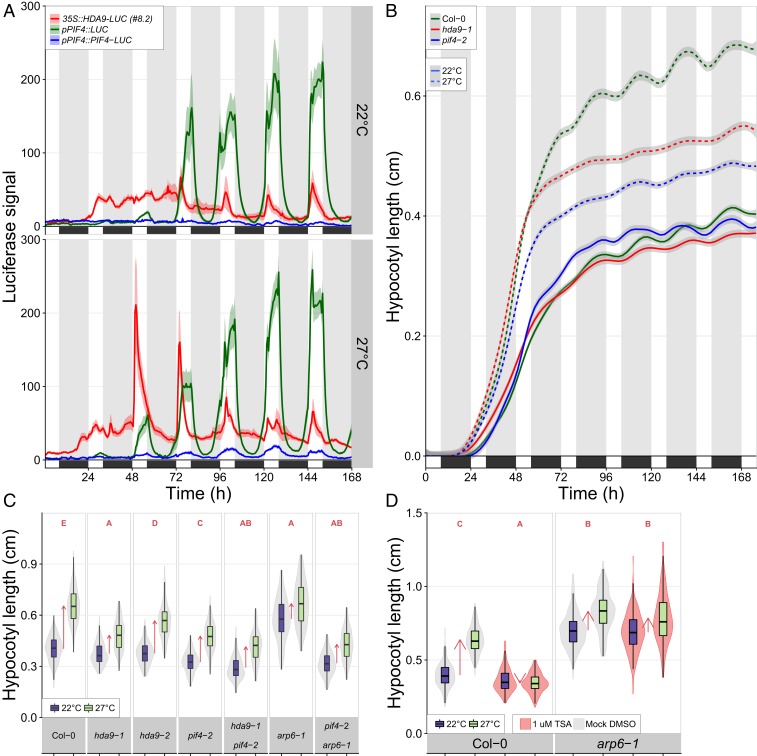
Fig. 2.
HDA9, PIF4, and ARP6/H2A.Z present a thermosignaling module. (A) Dynamics of HDA9 and PIF4 protein and PIF4 transcript levels. n = 6 to 19 per genotype. See SI Appendix, Fig. S3 for details. (B) Progression of hypocotyl elongation. n = 110 to 212 seedlings per genotype, per treatment, divided over 32 replicates. Statistics (Tukey HSD per time point, genotype, and treatment) are presented in SI Appendix, Fig. S4A and Dataset S1. (A and B) Colored areas behind lines represent SEM. Black boxes and gray-shaded bands/white bands indicate darkness/daytime. (C and D) Hypocotyl lengths of 8-d-old seedlings in D, the presence of TSA and mock. (C) n = 157 to 324 and (D) n = 157 to 324 seedlings per genotype and treatment, divided over 7 (C) and 9 (D) replicates. Boxes indicate boundaries of second and third quartiles of data distributions. Black bars indicate median and whiskers Q1 and Q4 values within 1.5 times the interquartile range. Violin plots designate phenotype distributions. Red arrows indicate the mean hypocotyl response. Red letters in C and D indicate statistical differences between hypocotyl responses (changes) (P < 0.01; 2-sided t test), with different letters indicating significantly different groups.

