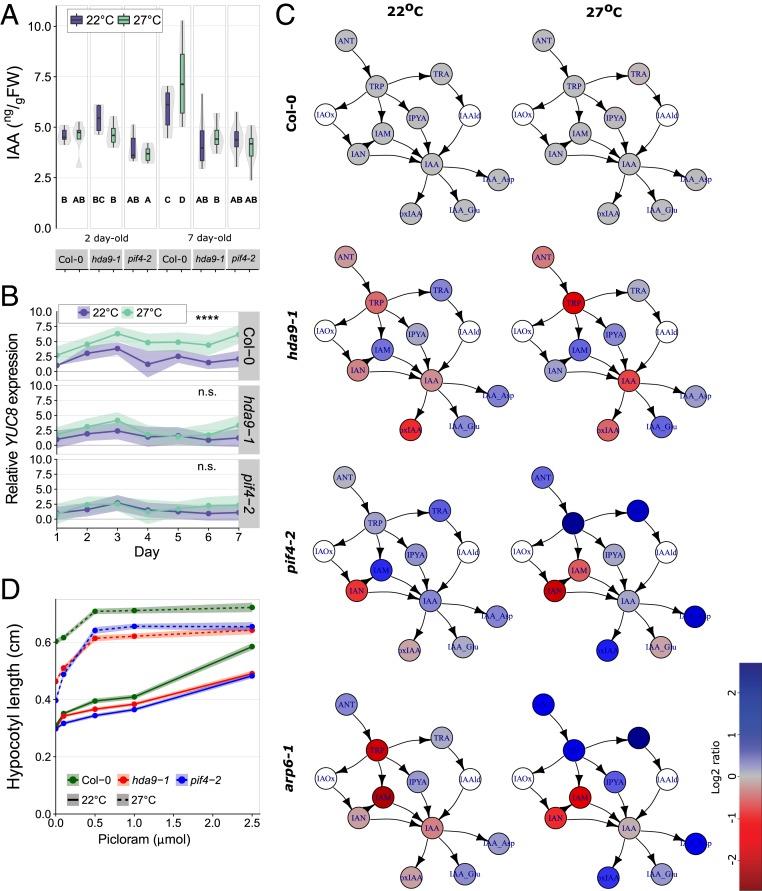
Fig. 3.
HDA9 is required for YUCCA8-dependent auxin biosynthesis. (A) IAA levels. Boxes indicate boundaries of second and third quartiles of data distributions. Black bars indicate median and whiskers Q1 and Q4 values within 1.5 times the interquartile range. Violin plots designate phenotype distributions. Bold letters indicate statistical differences between IAA levels over all samples (P < 0.05; Tukey HSD), n = 4 to 10 replicas per genotype per treatment per time point, each of 100 mg (FW) seedlings. (B) Relative YUCCA8 expression, 3 to 4 replicas per genotype, per treatment, per timepoint, each of >25 seedlings. Asterisks indicate significant difference on the range of time points between 22 °C and 27 °C (****P < 0.001, n.s. indicates nonsignificant; 2-sided t test). For statistical comparisons of individual time points, see Dataset S1. (C) Auxin metabolite levels, normalized to Col-0 wild-type. White symbols indicate not detectable. See SI Appendix, Fig. S8 for details and abbreviations of metabolites. n = 4 replicates per genotype and treatment, each of 10 mg (FW) of 2-d-old seedlings. (D) Hypocotyl lengths of 8-d-old seedlings in the presence of different concentrations Picloram, n = 104 to 132 seedlings per genotype per treatment divided over 4 replicates. See Dataset S1 for comparative statistics. (B and D) Colored areas behind the lines represent SEM.

