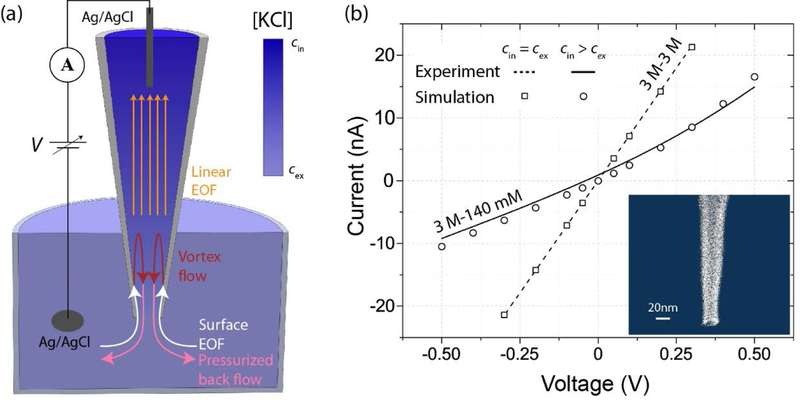
Figure 1.
(a) Experimental schematic depicting voltage application and KCl gradient (color), as well as electroosmotic flow (EOF) streamlines, when V < 0 V. (b) Experimental (curves) and simulated (symbols) current-voltage recordings for a pipette when cin = cex = 3 M (dashed curve, squares) and cin = 3 M, cex = 140 mM (solid curve, circles). (Inset) Scanning electron micrograph of representative nanopipette (note: not pipette corresponding to experimental data).

