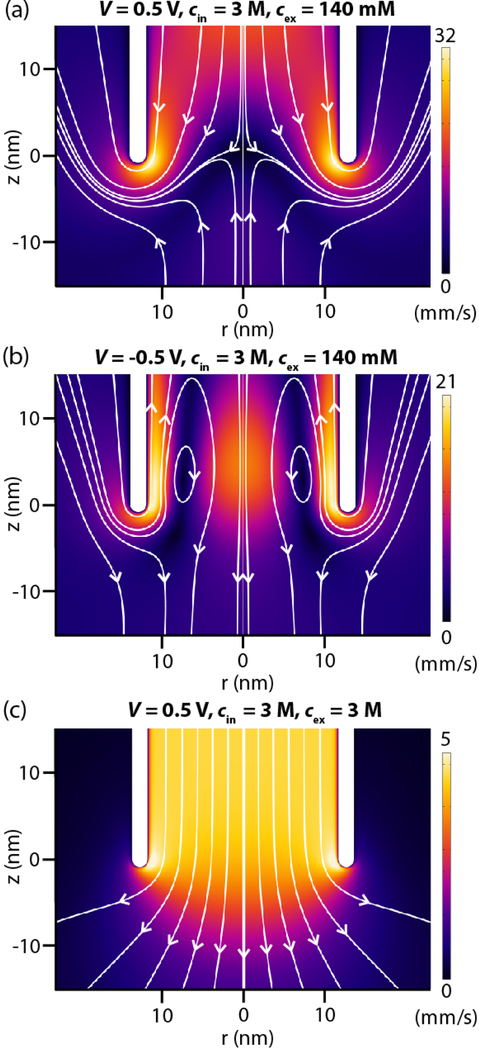
Figure 2.
Simulated EOF velocity heatmaps and streamlines at the tip of the pipette in Figure 1b. (a,b) A concentration gradient induces fluid vortices and nonlinear EOF. Vortex shapes are dependent on voltage polarity and are independent of voltage magnitude. (c) Under uniform concentration conditions, no vortex develops. Note that unequal scales are used to visualize flow rates and a concentration gradient increases EOF velocity.

