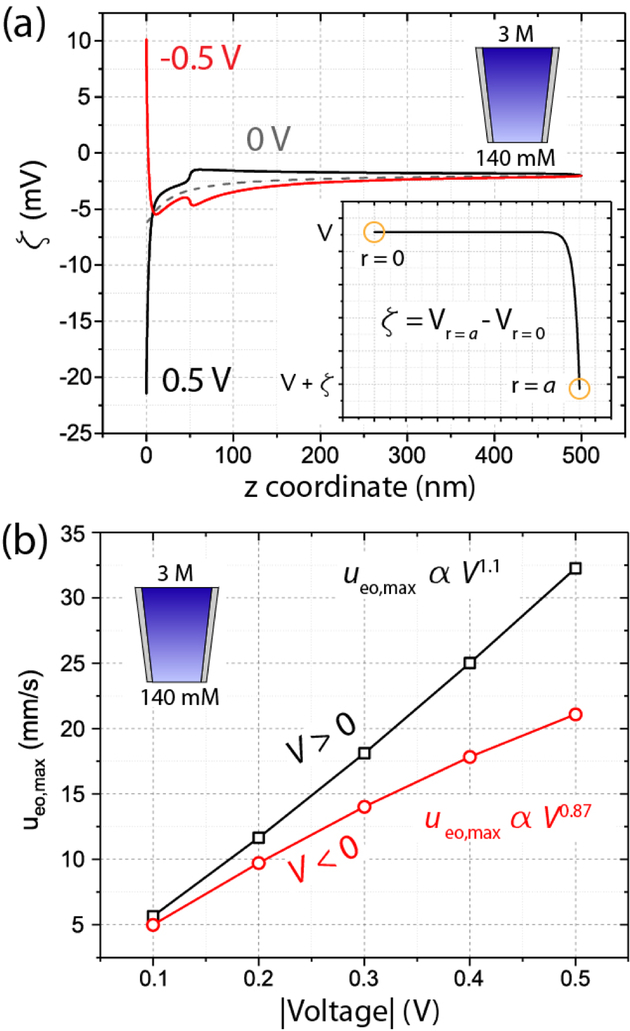
Figure 3.
Simulated nonlinear EOF for the pipette in Figure 1b, with cin = 3 M and cex = 140 mM. (a) Nonuniform zeta potential (ζ) distributions drive nonlinear EOF. When V = 0 V (gray), moderate zeta potential nonuniformity arises due to the concentration gradient. When V = ± 0.5 V, induced charge polarization exacerbates zeta potential nonuniformity and drives ICEO. (Inset) Radial voltage distribution showing calculation of zeta potential from simulation. (b) Maximum fluid velocity (ueo,max) scales superlinearly with voltage when V > 0 V (black curve) and sublinearly when V < 0 V (red curve), due to the contributions of ICEO flows.

