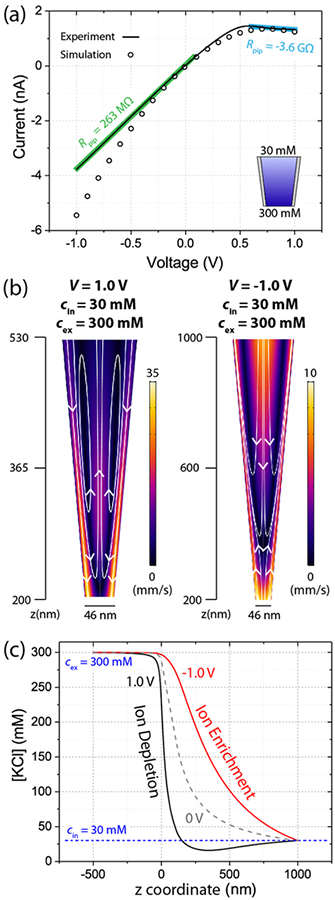
Figure 6.
(a) Experimental (line) and simulated (symbols) negative differential resistance (NDR) for a pipette when cin = 30 mM and cex = 300 mM. (b) Simulated EOF velocity heatmaps and streamlines for the pipette in (a). When V = 1.0 V (left), the vortex flows induce NDR. (c) Simulated centerline concentrations for the pipette in (a). EOF enriches (red) or depletes (black) concentration; during NDR, depletion reduces internal concentration below the levels of the filling solutions.

