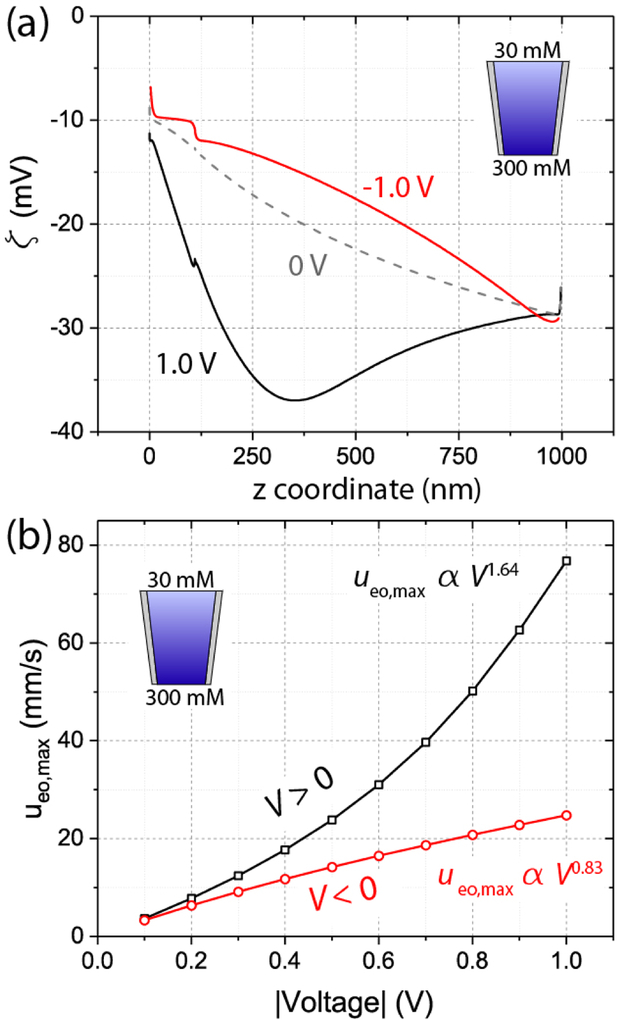
Figure 7.
Simulated nonlinear EOF for the pipette in Figure 6a (cin = 30 mM, cex = 300 mM). (a) Zeta potential (ζ) distribution when V = 1.0 V (black), 0 V (gray), and −1.0 V (red). Vortex flows in Figure 6b center around zeta potential maxima. (b) Maximum fluid velocity (ueo,max) scales superlinearly with voltage when V > 0 V (black curve) and sublinearly when V < 0 V (red curve).

