Figure 2.
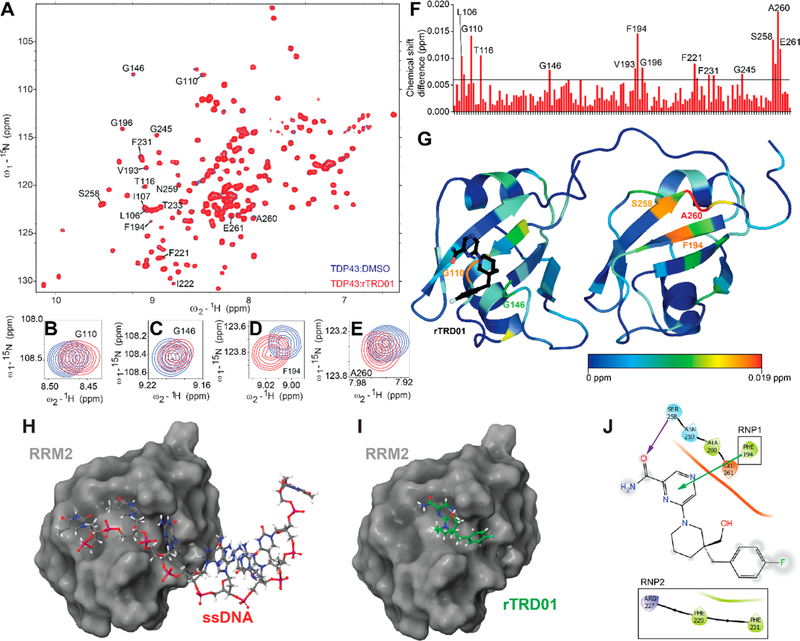
Mapping the binding of rTRD01 on TDP-43. (A) Superposition of 1H–15N heteronuclear single quantum correlation spectroscopy (HSQC) spectra of 15N-labeled human TDP-43102–269 (150 μM), free (blue) and in complex with rTRD01 in a TDP-43102–269/rTRD01 ratio of 1:4 (red). Close-up of shifts around TDP-43 residues G110 (B), G146 (C), F194 (D), and A260 (E). (F) Average chemical shift changes for assigned residues of the 15N-labeled TDP-43102–269 upon complex formation with rTRD01. The average chemical shift changes of cross-peaks were calculated as described in the Methods section. The horizontal line (0.09 ppm) is the threshold, calculated as described in the Methods section, above which a shift is considered significant. (G) Residues with chemical-shift perturbations upon rTRD01 binding are plotted onto the solution structure of TDP-43 (PDB code 4bs2) using a color gradient indicative of extent of the perturbation. (H) TDP-43-RRM2 domain (surface representation) crystallized with DNA (stick and ball representation) (PDB code 3d2w). (I) TDP-43-RRM2 domain (surface representation) docked with rTRD01 (stick and ball representation). (J) 2D representation of rTRD01 binding pocket that includes residues from the RNP1 and RNP2 of TDP-43 RRM2. The arrows represent predicted bonds (π–cation interaction, green, and halogen bond, purple).

