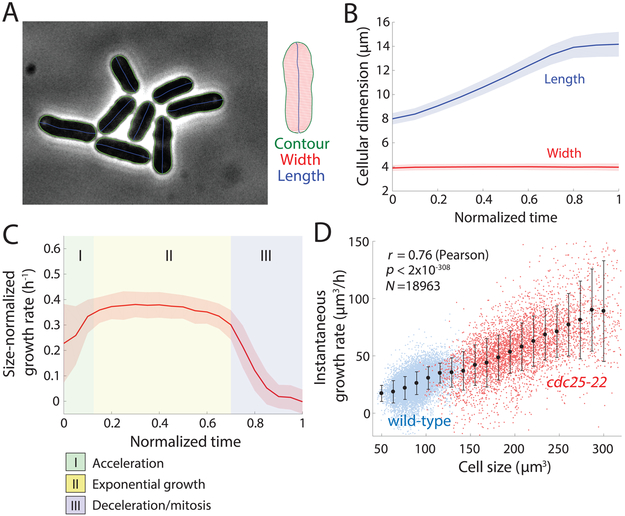
Figure 1: S. pombe cells grow exponentially.
A) Wild-type (WT) fission yeast cells imaged in phase contrast. Green outlines were obtained via automated segmentation (STAR Methods). Manual inspection revealed that segmentation was accurate for virtually all cells, regardless of cell crowding.
B) Population-averaged length and width of growing fission yeast cells, measured as a function of time after the mechanical separation of daughter cells after septation normalized by cell-cycle time (n = 1129 cells). Solid lines and shaded areas represent the mean ±1 standard deviation (S.D.). Cell width was essentially invariant, while length increased over the cell cycle until the cell reaches the division length of ~14 μm.
C) Instantaneous size-normalized growth rate of wild-type cells, as a function of normalized cell-cycle time as in (B). The size-normalized growth rate was constant for a large fraction of the cell cycle, signifying growth proportional to size (exponential growth). Cells had three phases of growth: (I) super-exponential acceleration, (II) steady-state exponential growth, and (III) deceleration as cells approach mitosis. Shading represents ±1 S.D. (n = 1129 cells).
D) Instantaneous growth rate dV/dt increases with cell size. The trend for wild-type (WT) cells (blue) continued for cdc25-22 cells (red), which are substantially longer. Black lines represent best linear fits for each strain (wildtype, n=1129 cells; cdc25-22, n=246 cells). Error bars are ±1 S.D.

