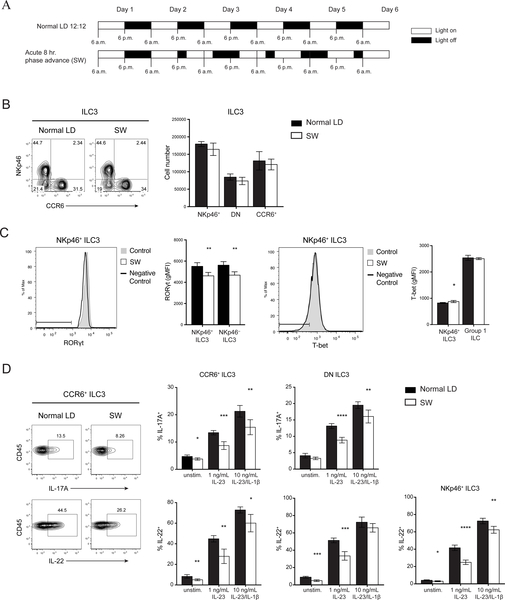
Figure 2. Acute circadian disruption alters ILC3 cytokine secretion.
A) Diagram of light settings in acute SW model of circadian disruption. B) Representative plots (left) and numbers (right) of siLP ILC3 subsets in control and SW mice. C) Representative histogram and quantification of RORgt (left) and T-bet (right) expressions by intracellular staining in ILC3 subsets and group 1 ILCs (ILC1 and NK cells), horizontal bars in histograms represent negative control gate. gMFI, geometric mean fluorescence intensity. D) Representative plots (left) and quantifications (right) of IL-17A and IL-22 production in ILC3 subsets after in vitro stimulation with indicated concentrations of IL23±IL-1β. Statistical analysis was performed using Student’s t test. Bars indicate means (±SD). * P < 0.05; ** P < 0.01; *** P < 0.001; **** P < 0.0001. Data are representative of two independent experiments (n=5 per group per experiment) (A to D).

