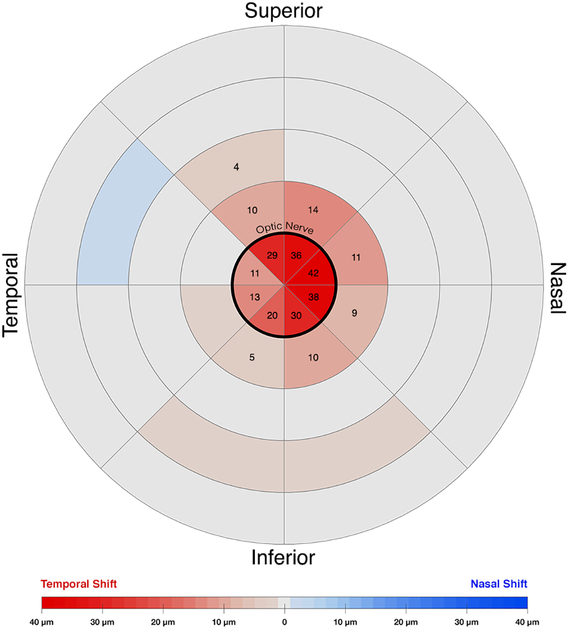
Fig. 5.
Horizontal displacement heatmap during adduction in younger subjects. The center circle represents the optic nerve head. Temporal shifts are colored red, nasal shifts blue. Numbers denote zones exhibiting significant displacement during adduction. The nasal half of the nerve head showed the greatest temporal deformation.

