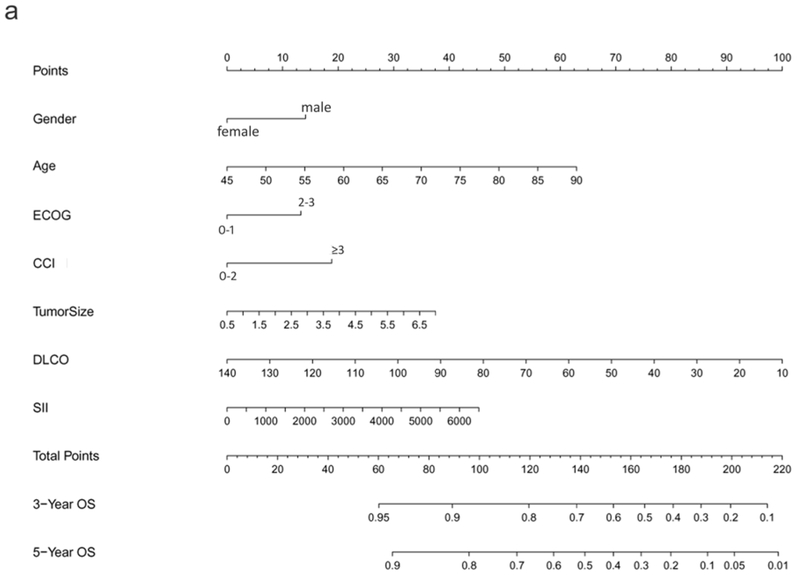
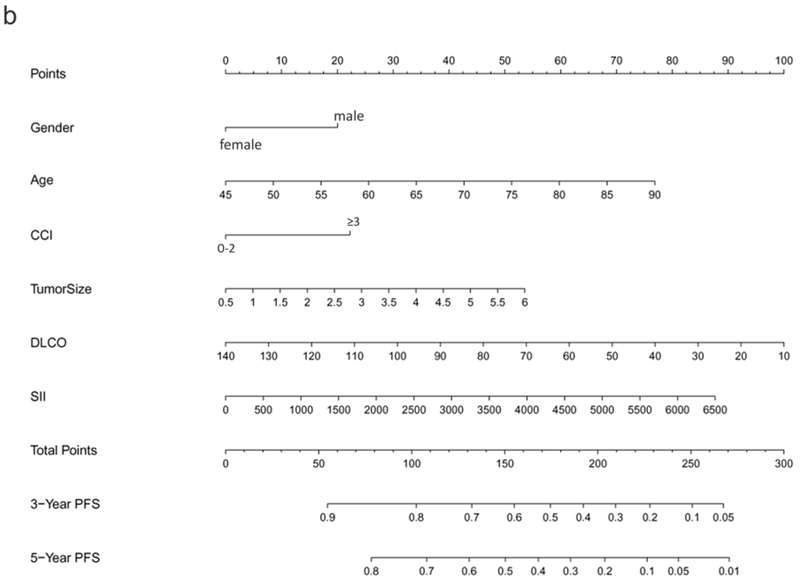
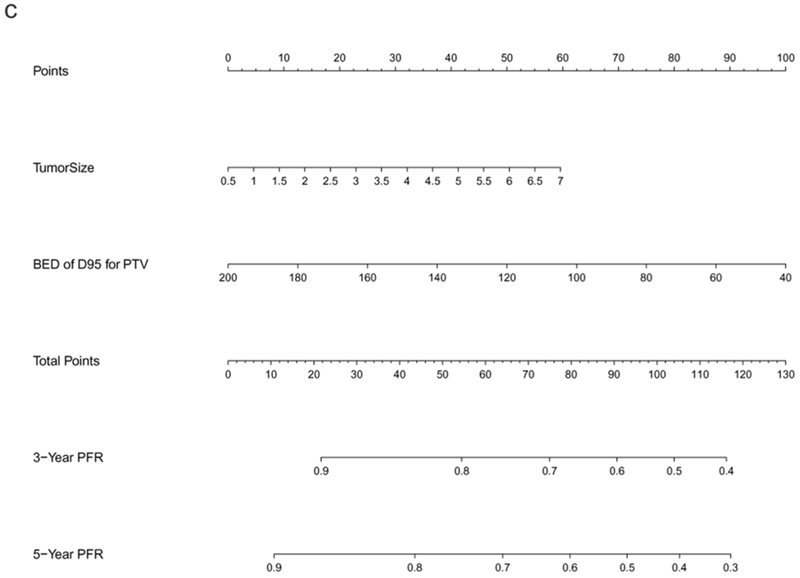
Figure 1.
Nomograms predicting 3- and 5-year prognoses for ES-NSCLC after SABR based on the training set (n=572): (a) overall survival (OS); (b) progression-free survival (PFS); and (c) progression-free rate (PFR). Note: to use the nomograms, the Score for each predictor is obtained by drawing a vertical line upward to the Points Axis, and the Total Risk Score is calculated by summating the scores associated with each predictor and is identified on the Total Points Axis. Thus, the final predicted 3- and 5-year prognoses are read by drawing a vertical line downward from Total Points to the lower scales.


