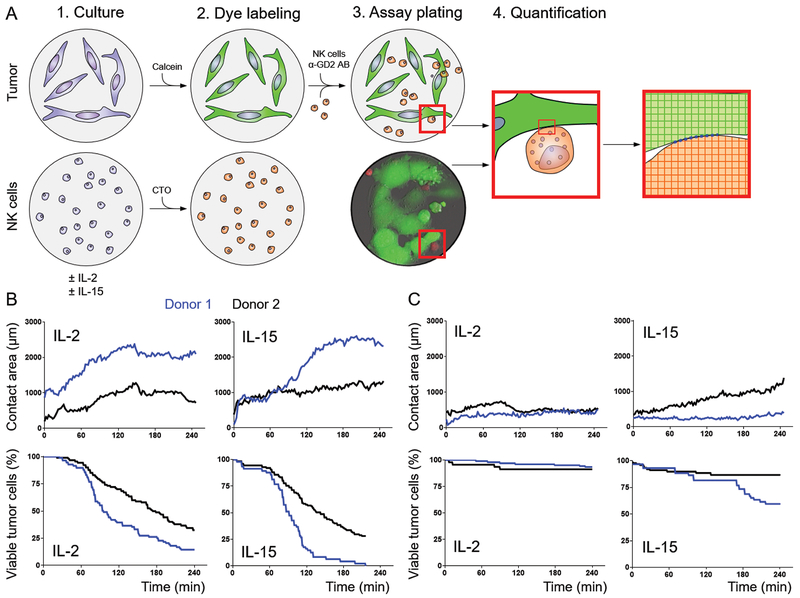
Figure 2.
Quantification of NK cell–neuroblastoma contact. A, One day before the assay, NK cells were grown in culture in NK cell media supplemented with IL-2 or IL-15, and neuroblastoma cells were plated. On the day of the assay, neuroblastoma cells were labeled with calcein-AM, and NK cells were labeled with CellTracker Orange. Hu14.18K322A and dye-labeled NK cells were added to the wells, and the contact between neuroblastoma cells and NK cells was imaged and later quantitated in silico. Five different areas were imaged per condition and the mean is plotted per time point. B and C, The assay was conducted with NK cells from two allogeneic donors and the two neuroblastoma cell lines CHLA-90 (B) and SK-N-AS (C). The normalized contact area and relative percentage of viable tumor cells are plotted over time for IL-2– and IL-15–activated NK cells from two donors (donor 1 = blue, donor 2 = black).

