Figure 5.
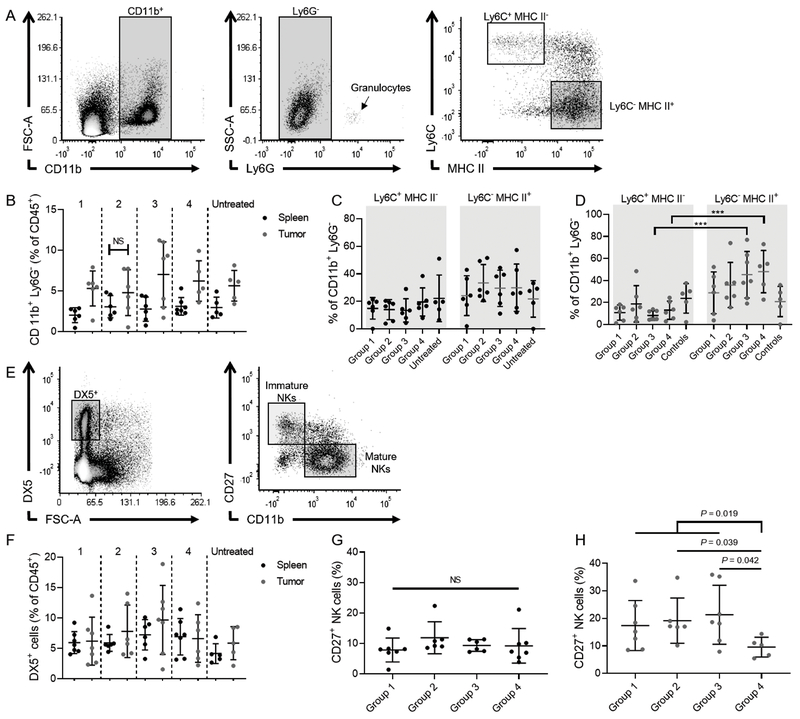
Phenotype of tumor-associated macrophages/monocytes and NK cells in tumors and spleens of mice treated with chemoimmunotherapy. A, Gating strategy to identify CD11b+Ly6G−Ly6C+MHC II− and CD11b+Ly6G−Ly6C−MHC II+ monocytes/macrophages. B, Percentage of CD11b+Ly6G− cells of all CD45+ cells in spleens (blue) and tumors (red). C and D, Groups refer to the assignment shown in Fig. 4B. Percentages of CD11b+Ly6G−Ly6C+MHC II− and CD11b+Ly6G−Ly6C−MHC II+ in spleens (C) and tumors (D). E, Gating strategy to identify DX5+CD27+CD11b− immature NK cells and DX5+CD27−CD11b+ mature NK cells. F, Percentage DX5+ NK cells of all CD45+ cells in spleens (blue) and tumors (red). G and H, Percentages of immature NK cells in spleens (G) and tumors (H).

