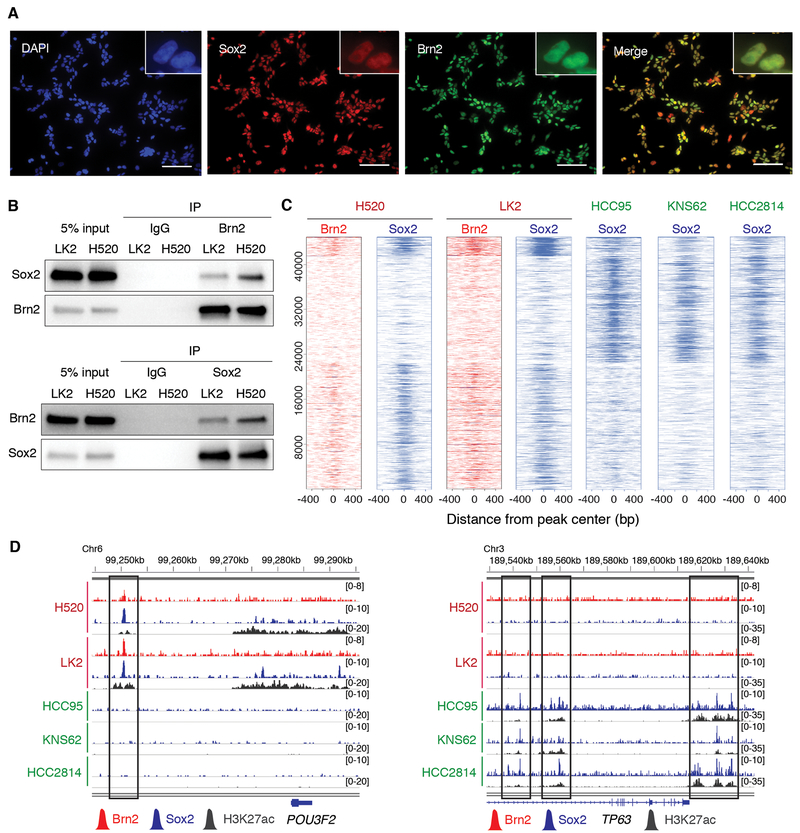
Figure 4.
Brn2 and Sox2 interact and co-localize at genetic loci in the ‘neural’ subset of LUSC. A, Expression of endogenous Brn2 and Sox2 in LK2 cells, determined by immunofluorescence with anti-Sox2 (green) and anti-Brn2 (red) antibodies, respectively. DAPI staining (nuclei; blue) and merged images are also shown. Original magnification, ×200. Scale bar, 100 μm. B, Sox2-Brn2 interaction, shown by co-immunoprecipitation of Sox2 using an antibody against endogenous Brn2 (top) and co-immunoprecipitation of Brn2 using an antibody against endogenous Sox2 (bottom) in LK2 and NCI-H520 cells. C, Heatmap depicting global analysis of ChIP-seq signals for Brn2 and Sox2 in ‘neural’ NCI-H520 and LK2 cells and those for Sox2 in ‘classical’ HCC95, KNS62 and HCC2814 cells at all the peak loci. ChIP-seq signal intensity is shown by color shading. D, Genome view tracks of Brn2, Sox2 and H3K27ac ChIP-seq signals in NCI-H520 and LK2 cells, and Sox2 and H3K27ac ChIP signals in HCC95, KNS62 and HCC2814 cells at loci of POU3F2 (left) and TP63 (right).

