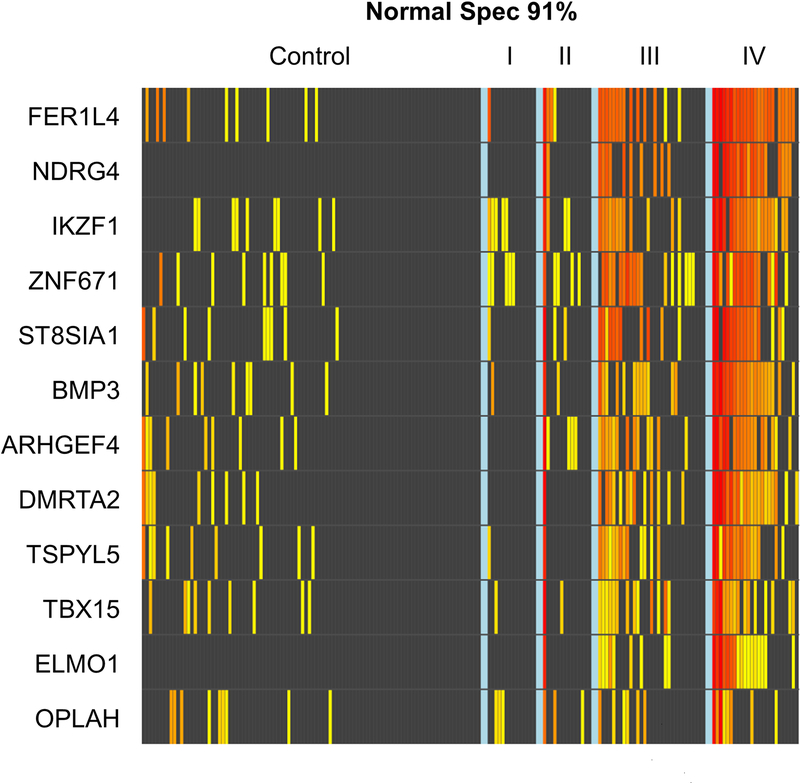
Figure 2.
Beta-actin corrected methylation intensity in DNA markers assayed from plasma.
Each column on the x-axis represents an individual patient’s sample; each row on the y-axis represents the methylation specific PCR product by QuARTS assay for each marker on a logarithmic scale. A 91% specificity threshold was selected by the rPart model. Increasing yellow-red color spectrum reflects increasing methylation intensity above the 91st percentile value of the control patient samples.

