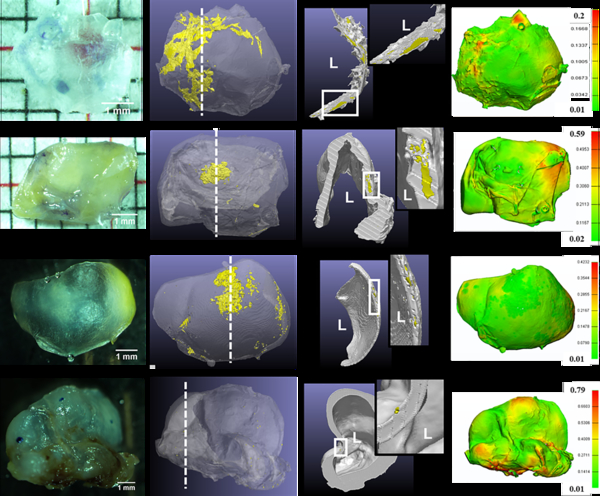
Figure 1:
Diversity of calcification morphology, location and tissue surface appearance as seen with high resolution micro-CT for four representative aneurysm samples (Rows 1–4). 3D reconstructed and cross-section images of the micro-CT scans show calcification in yellow and non-calcified tissue in grey. Cross section images are taken at locations indicated by a dashed white line in the 3D reconstruction image. L indicates lumen and insets show calcified region at higher magnification. Wall thickness contours are in mm.

