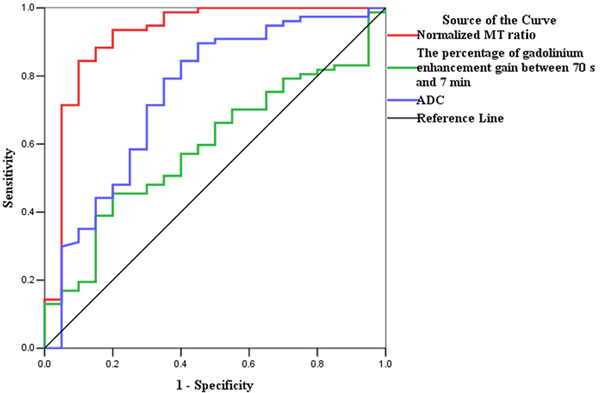
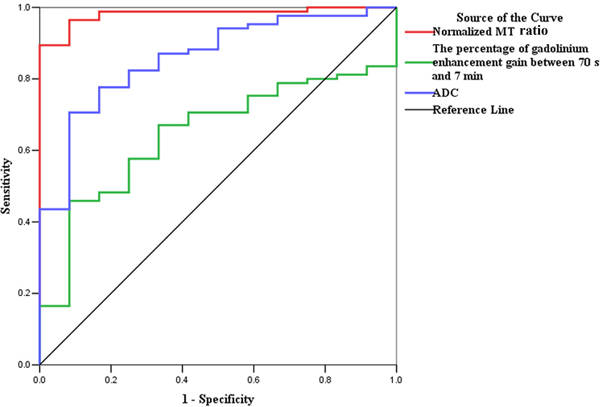
Fig. 5.
ROC analysis for the data from derivation set. (a) The normalized MT ratio is highly accurate on ROC analysis with an AUC of 0.919 (95% CI, 0.832–1.000; P=0.000) for distinguishing moderately-severely fibrotic from non-fibrotic and mildly fibrotic bowel walls, followed by ADC (AUC=0.747; 95% CI, 0.615–0.879; P=0.001) and the percentage of enhancement gain (AUC=0.592; 95% CI, 0.464–0.719; P=0.209). (b) The ROC curve also demonstrates the highest accuracy of normalized MT ratios with an AUC of 0.981 (95% CI, 0.956–1.000; P=0.000) for differentiating fibrotic and non-fibrotic bowel walls, followed by ADC (AUC=0.860; 95% CI, 0.761–0.959; P=0.000) and the percentage of enhancement gain (AUC=0.646; 95% CI, 0.514–0.778; P=0.103). (CI, confidence interval; ROC, receiver operating characteristics; MT, magnetization transfer; AUC, the area under the ROC curve; ADC, apparent diffusion coefficient)


