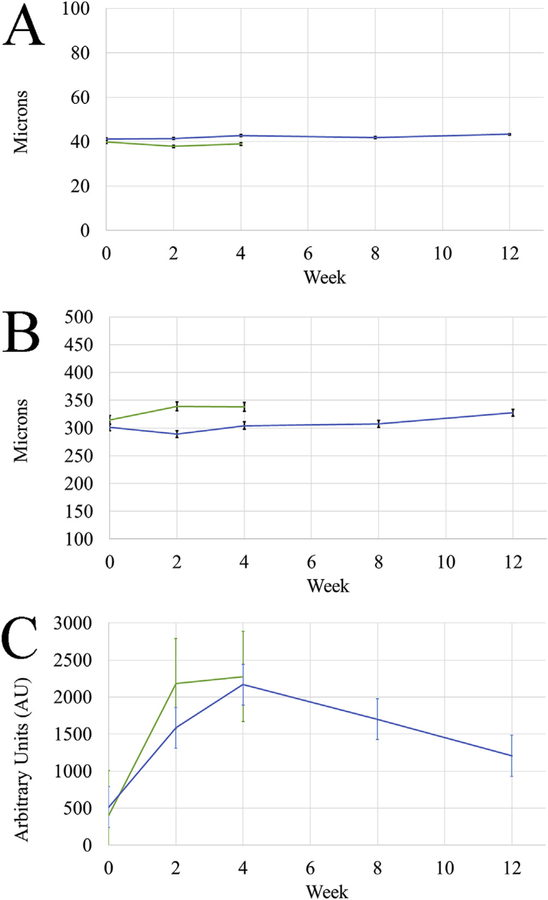
Fig. 2. In vivo CMTF Measurements.
Changes in epithelial and stromal thickness for both groups were measured over time. Plots of these measurements are shown in A and B respectively, with week 0 referring to initial baseline measurements prior to treatment and all other time points referring to the number of weeks after treatment. Both thickness measurements remained relatively constant, with only the three month stromal thickness being significantly different from initial values. Graph C shows the haze measured in arbitrary units at each time point throughout recovery, calculated as the area under the curve of a plot of intensity through the depth of the cornea. In both groups haze peaked at one month and then began to decrease in group 2.

