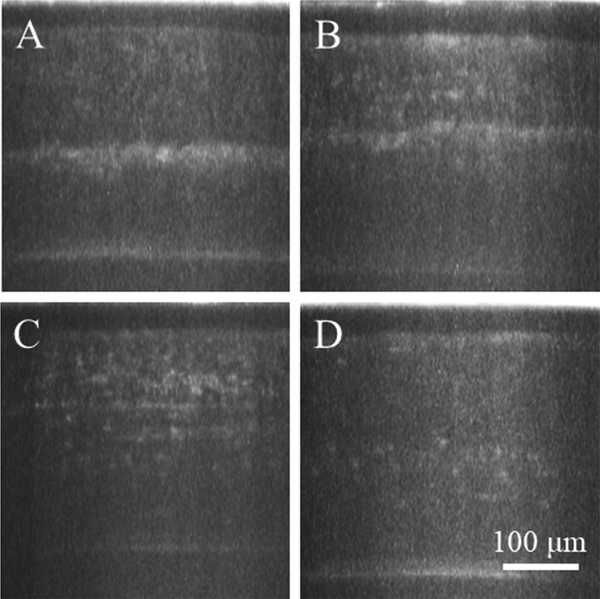
Fig. 3. Cross Sectional CMTF Images.
A visual representation of haze at each week is provided in the images, corresponding to 2 (A), 4 (B), 8 (C), and 12 (D) weeks post treatment. Each image is a cross sectional projection of the through focus images taken at each time point. At the two week time point (A), most of the haze is concentrated to the area just below the treated region. Throughout recovery (B–D) haze spreads, peaking in intensity at one month (B), and then decreases.

