Figure 3.
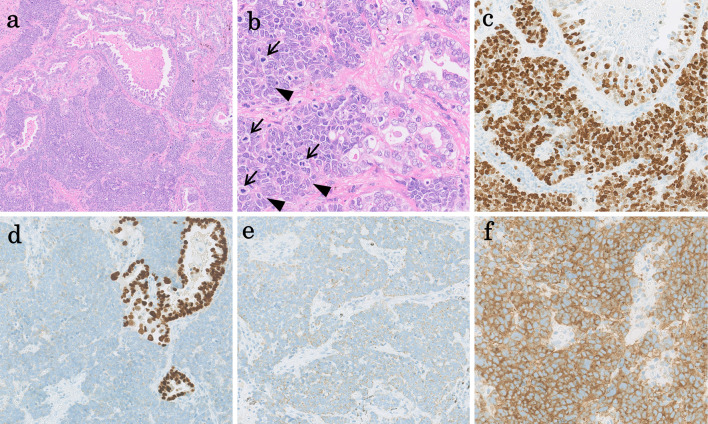
(a) Hematoxylin and Eosin staining, original, 4×. Low magnification shows the proliferation of tumor cells with an acinar pattern of adenocarcinoma (right upper) as well as a solid pattern of LCNEC (lower). A pathological examination revealed that the combined LCNEC and adenocarcinoma consisted of 90% LCNEC and 10% adenocarcinoma. (b) Hematoxylin and Eosin staining, original, 40×. On higher magnification, the adenocarcinoma(right) shows gland formation with a small amount of mucous production. The LCNEC(left) shows a solid nest with rosette-like structures (arrowheads) and nuclear moldings. The LCNEC cells shows relatively large nuclei with conspicuous mitoses (arrows). (c) Original, 20×. The LCNEC (lower) shows a Ki67/MIB-1 index of 93%, which is higher than that of adenocarcinoma (right upper). (d) Original, 20×. The adenocarcinoma component (right) shows positivity for TTF1, whereas the LCNEC component shows negativity. (e, f) Original, 20×. The neuroendocrine markers of chromogranin A (e) and synaptophysin (f) are positive in the LCNEC area. LCNEC: large-cell neuroendocrine carcinoma

