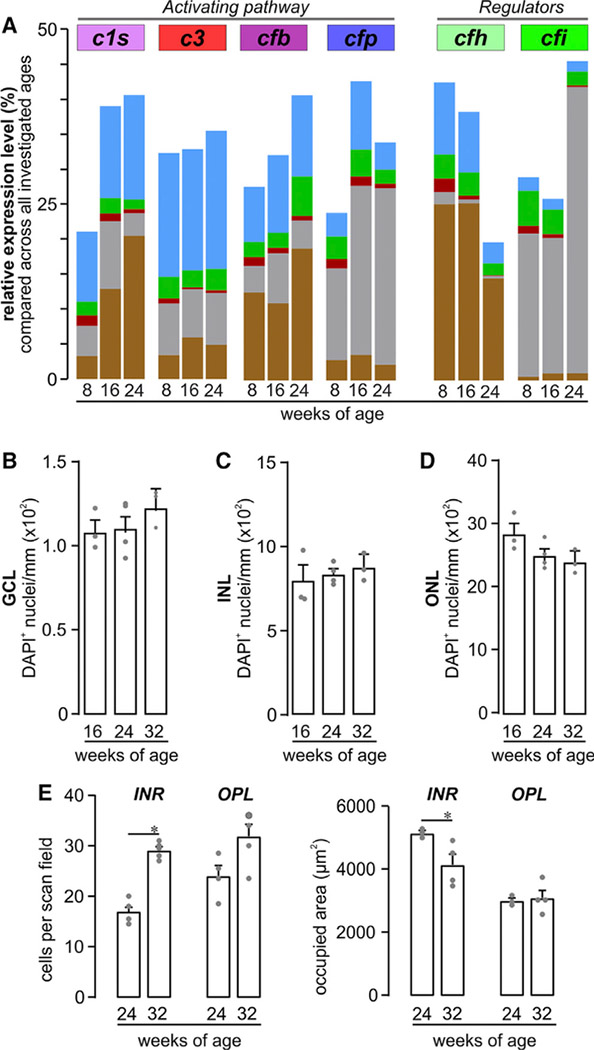
Figure 5. Retinal Phenotype and Complement Homeostasis in Aging Albino Mice.
(A) Expression levels of c1s, c3, cfb, cfp, cfh, and cfi were determined from cells of albino mice at the mRNA level (bars) at the indicated ages. The overall putative contribution of each cell population to the local complement homeostasis was determined by analyzing the total yield of mRNA derived from the respective cell population.
(B-D) The quantities of DAPI+ cell nuclei in the (B) GCL, (C) INL, and (D) ONL were comparable in 16− to 32-week-old albino retinae.
(E) Left: microglia were quantified in the inner retinal layers (INR) such as ganglion cell and inner plexiform layer and additionally in the outer plexiform layer (OPL) on basis of Iba1 labeling in mice of the indicated age. Right: the area occupied by processes of a single microglia was measured as exemplarily depicted by the dashed circles of different color for OPL microglia in (D). Bars represent mean values ± SEM from 2–4 animals. *p < 0.05, **p < 0.01, Mann-Whitney U test. See also Figure S2 and Table S7.

