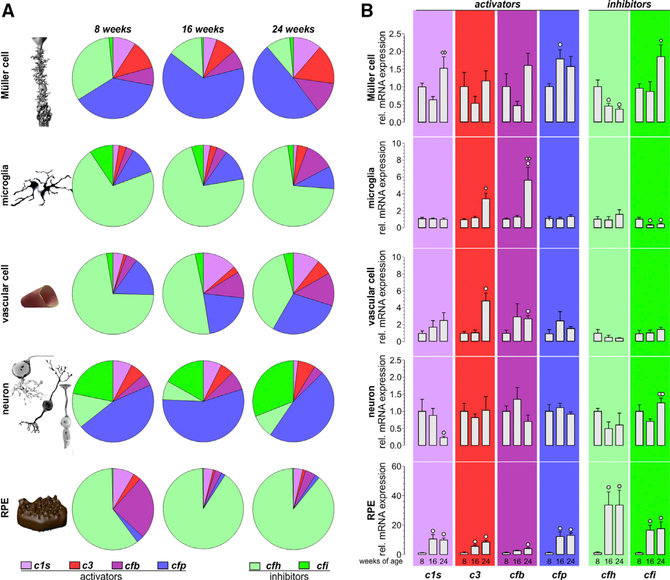
Figure 6. Comparison of Complement Component Expression between Retinal Cell Types of Aging Mice.
(A) Expression of complement components was determined by quantitative real-time PCR. Diagrams represent the relative amount of transcripts per cell (normalized to the idh3b housekeeper expression) of the different complement components in the respective cell type enriched from mice at the indicated age. Note the high expression level of inhibitory complement factors in RPE/choroid samples as well as in microglial and vascular cells, while complement-activating genes appear to dominate in Müller cells and neurons. Data were collected from 4–6 wild-type albino mice (numbers are given in Table S4).
(B) Complement expression analysis by quantitative real-time PCR was performed on enriched retinal cell types from 8-, 16-, and 24-week-old mice. Bars represent mean values ± SEM of cells purified from 4–6 animals. Mann-Whitney U testing was performed on all data. A circle indicates a significant difference compared to the expression level at 8 weeks of age; whereas a diamond indicates a significant difference compared to the expression level at 16 weeks of age. °/◇ p < 0.05; ° °/◇◇p < 0.01.

