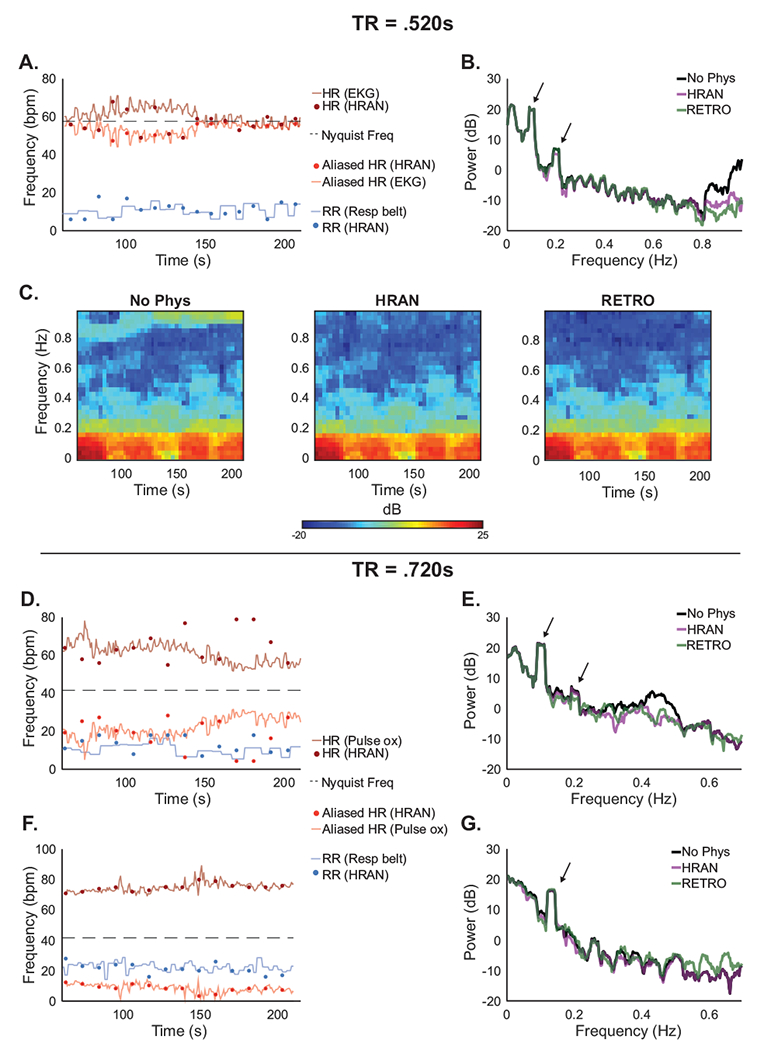
Figure 9: Performance of HRAN varies with TR and physiology.

HRAN may be effective even if fMRI data is sampled below the Nyquist frequency, though to a limited extent. (A) With TR = .520s, the respiratory frequencies estimated by HRAN (blue dots) track the respiration rate obtained using external recordings (blue line), though the cardiac estimates (dark red dots) do not always track the heart rate (dark red line) directly; however, the aliased HRAN cardiac estimates (light red dots) track the aliased heart rate (light red line). (B-C) Power spectra and spectrograms of the ROI demonstrate removal of physiological noise. Neurally-relevant peaks indicated by arrows. (D,F) The cardiac frequencies may alias into respiratory frequency bands and limit HRAN estimation, or into a distinct frequency band where HRAN still performs well (examples have TR = .720s). (E,G) Power spectra demonstrate removal of the physiological noise to varying degrees. Neurally-relevant peaks indicated by arrows.
