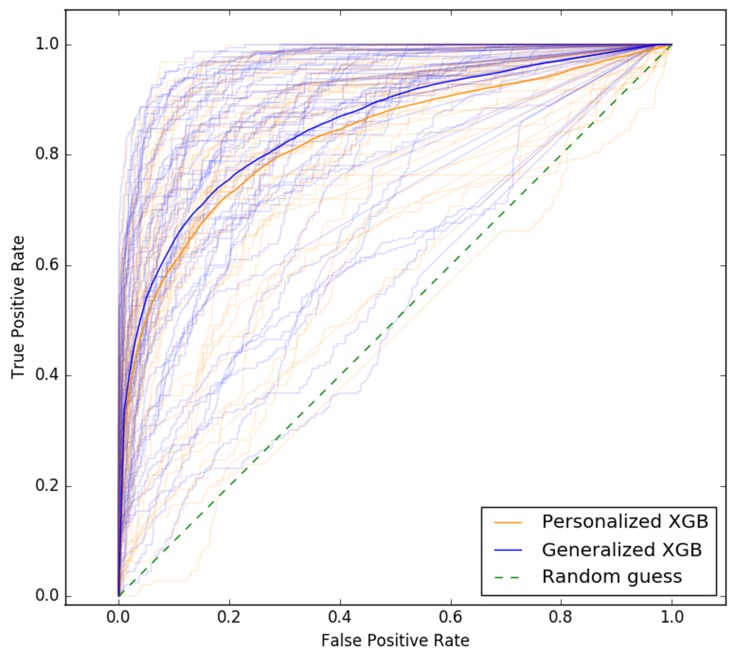
Figure 1.
ROC curves of personalized and generalized XGB sleep-wake states predictors. The two darker ROC curves show the performance of the generalized predictor (blue) and personalized predictors (orange) averaged over all individuals across all studies. The lighter curves show performance of the generalized XGB predictor and personalized XGB predictors tested on each individual. © 2018 IEEE. Reprinted, with permission, from Khademi A, El-Manzalawy Y, Buxton OM, Honavar V. Toward personalized sleep-wake prediction from actigraphy. In 2018 IEEE EMBS International Conference on Biomedical and Health Informatics, BHI 2018 (Vol. 2018-March, pp. 414–417). Institute of Electrical and Electronics Engineers Inc. https://doi.org/10.1109/BHI.2018.8333456.45

