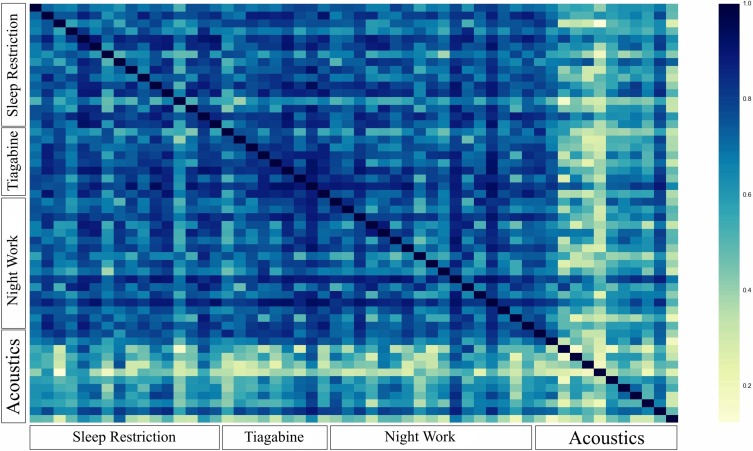
Figure 2.
Heatmap of the similarity between participants obtained according to the defined similarity measure. Axes group participants based on the study they were in. Each pixel corresponds to one participant. Dark blue means maximum similarity and yellow means minimum similarity. Participants from the Acoustics study are observed to be different than each other and those from other studies potentially explaining the difference in the performance of our predictive models on them.

