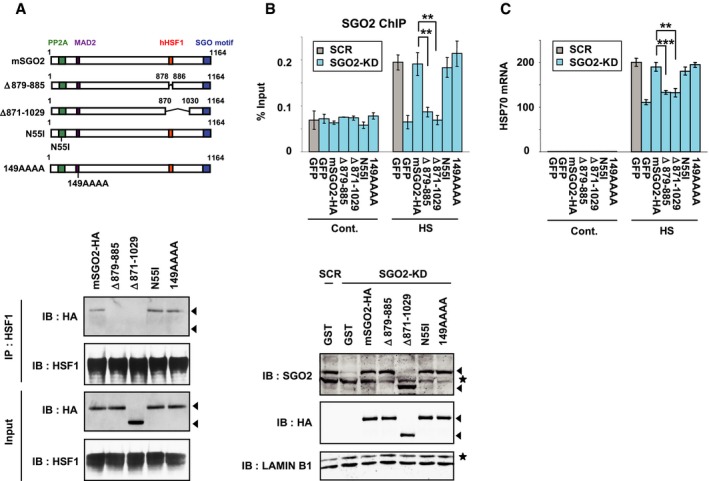
Figure EV3. Replacement of endogenous SGO2 with its interaction mutants.

- Interaction of mSGO2 deletion mutants with hHSF1. MEF cells were co‐infected with adenovirus expressing hHSF1‐Flag and HA‐tagged mSGO2 deletion mutants, including mSGO2Δ879–885, mSGO2Δ871–1,029 (no interaction with hHSF1), mSGO2‐N55I (no interaction with PP2A), and mSGO2‐149AAAA (the “AHLP” motif was replaced with “AAAA”, no interaction with MAD2) (Kitajima et al, 2006; Orth et al, 2011). These cells were treated with heat shock at 42°C for 30 min. Complexes co‐immunoprecipitated with hHSF1 were blotted with HA or HSF1 antibody. Arrowheads indicate band positions of mSGO2 mutants in the third blot. Arrowheads in the top blot indicate expected band positions of mSGO2 mutants.
- SGO2 occupancy in the presence of mSGO2 mutants. MEF cells, in which endogenous SGO2 was substituted with each HA‐tagged mSGO2 mutant or GFP, were untreated (Cont.) or treated with heat shock at 42°C for 5 min (HS). ChIP‐qPCR analyses in the pHSE of HSP70 promoter were performed (upper). Extracts of cells were prepared in buffer C and subjected to immunoblotting using SGO2, HA or lamin B1 antibody (lower). Arrowheads indicate band positions of mSGO2 mutants in SGO2 and HA blots, and asterisks indicate non‐specific bands.
- HSP70 expression in the presence of mSGO2 mutants. Cells, in which endogenous SGO2 was substituted with each HA‐tagged mSGO2 mutant, were untreated (Cont.) or treated with heat shock at 42°C for 30 min (HS). HSP70 mRNA levels were quantified by RT–qPCR.
