
Figure 1.
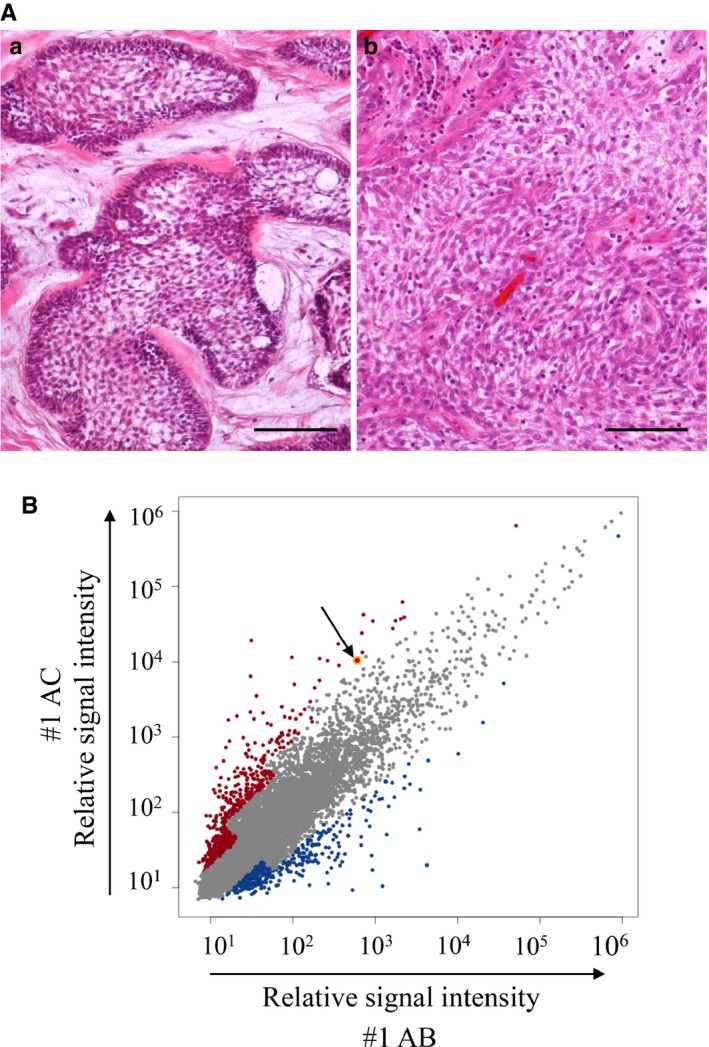
Histological feature and gene expression analyses in AB and AC. A, HE staining of #1AB (a) and #1AC (b). Tumor cell nests reveal peripheral columnar cell palisading and loosely arranged central stellate cell feature (a). The tumor cells reveal severe cellular atypia such as large and hyperchromatic nuclei and prominent nucleoli (b). Scale bars: 100 μm. B, Scatterplots representing the expression of genes in #1AB and #1AC x‐axis indicates normalized log2 signal intensity of #1AB, and y‐axis indicates normalized log2 signal intensity of #1AC. Blue and red dots indicate genes which are upregulated in #1AB and in #1AC, respectively. The yellow dot pointed by an arrow indicates HIF1A gene expression