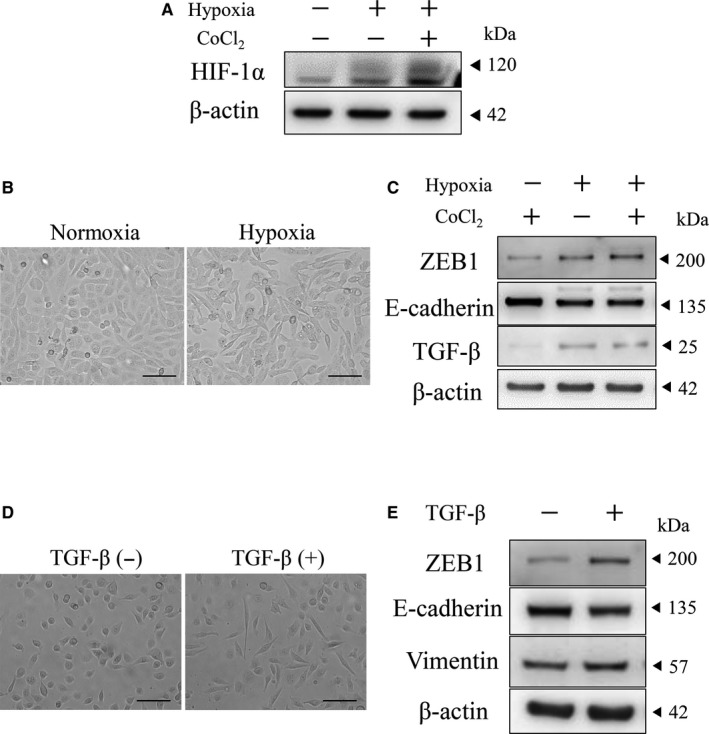
Figure 3.

Hypoxia induced HIF‐1α and ZEB1 expressions and EMT in AM‐1 cells. A, Western blots of HIF‐1α in normoxia (hypoxia: −) or hypoxia (hypoxia: +) condition with or without 100 μmol/L CoCl2. Molecular weight is pointed by an arrowhead. B, Morphological changes of AM‐1 cells in normoxia (a) and hypoxia (b) condition. Scale bars: 100 μm. C, Western blots of ZEB1, E‐cadherin and TGF‐β in hypoxia (−) and hypoxia (+) condition with or without 100 μmol/L CoCl2. Molecular weight is pointed by an arrowhead. β‐actin; internal control. D, Morphological changes of AM‐1 cells in control (a) and TGF‐β treatment (b). Scale bars: 100 μm. E, Western blots of ZEB1, E‐cadherin and vimentin with or without TGF‐β. Molecular weight is pointed by an arrowhead. β‐actin; internal control
