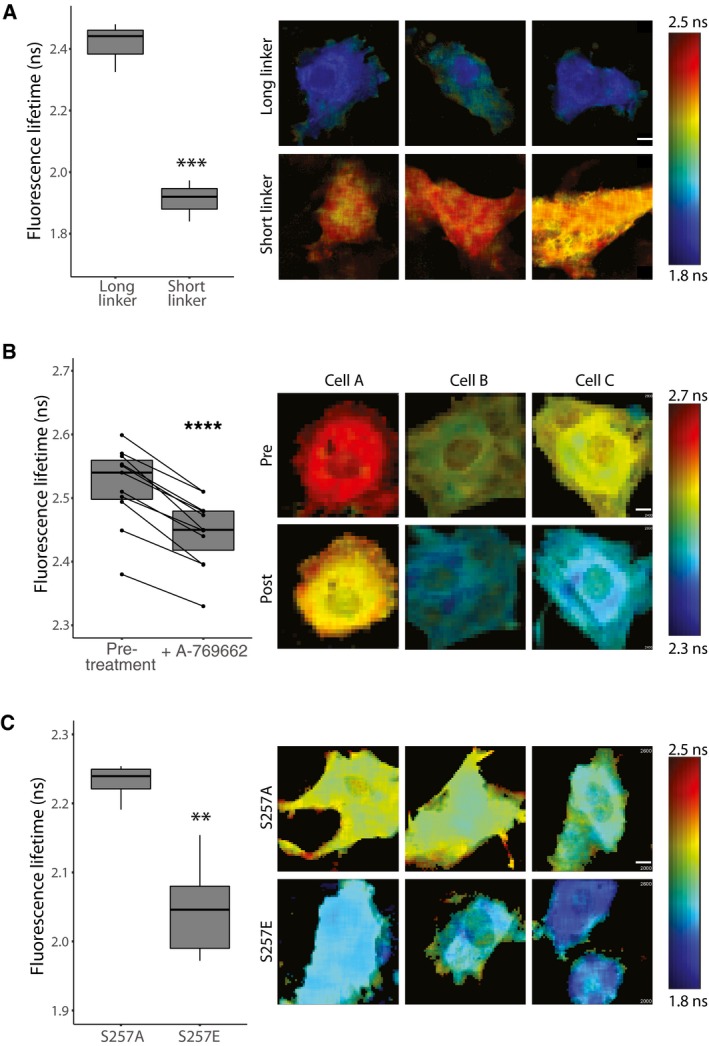
Time‐correlated single‐photon counting was used to estimate the fluorescence lifetime of mClover2.
The mClover2:tagRFP‐T fret pair was validated in HEK‐E cells with the fluorophores joined by either a long rigid or short flexible linker.
STIM1 OASF expressed in live L6 myoblasts before (−) or after (+) treatment with A‐769662.
L6 myoblasts with S257 mutated to A or E.
Data information: Mean lifetimes were estimated by fitting a single exponential decay to the TCSPC data and are presented as median ± min/max. Three representative cells are shown for each condition. For A and C, **
P < 0.001, ***
P < 0.0001, unpaired Student's
t‐test,
n = 3–5 independent observations. For B, ****
P < 0.00001, paired Student's
t‐test,
n = 11 independent observations. For box and whisker plots, the horizontal lines represent the medians, the upper and lower boundaries of the boxes represent the upper and lower quartiles, and the whiskers represent the upper and lower extremes. Scale bars = 10 μm.
Source data are available online for this figure.

