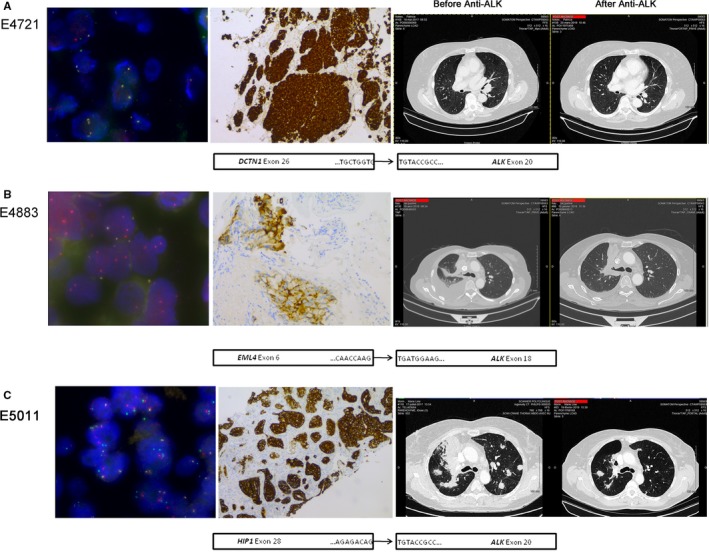
Figure 2.

Representative images showing the presence of ALK rearrangements in E4721 (A), E4883 (B), and E5011 (C) patients. All left panels show representative images of rearranged tumors with either a classic break‐apart pattern with one fusion signal and two split red and green signals or a less common pattern with isolated red signal(s) combined with fused signals (×100). Representative medium (2+) to strong (3+) IHC staining are shown in middle panels. Thoracic computed tomography scans of patients before and after targeted therapy are shown in the right panels and schematic representations of the fusion transcript for each case are presented below the three panels. IHC, immunohistochemistry
