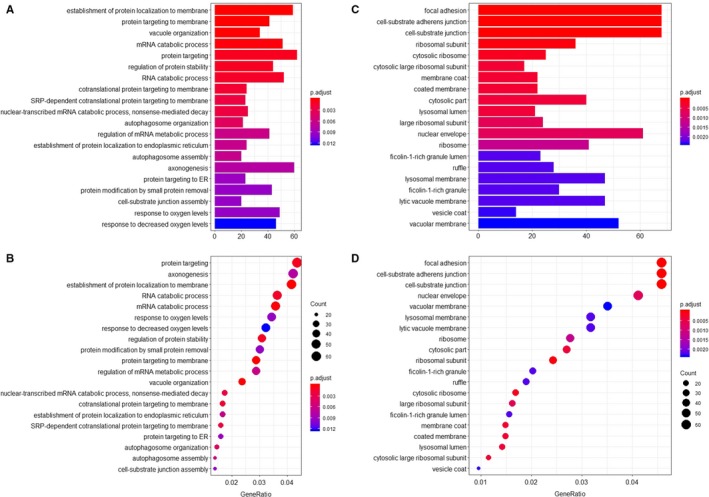
Figure 3.

The enrichment analysis of gene symbols in survival‐associated alternative splicing events. The top 20 enriched terms are displayed. A, A bar chart showing the terms of biological process. B, A bubble chart showing the terms of biological process. C, A bar chart showing the terms of cellular component. D, A bubble chart showing the terms of cellular component
