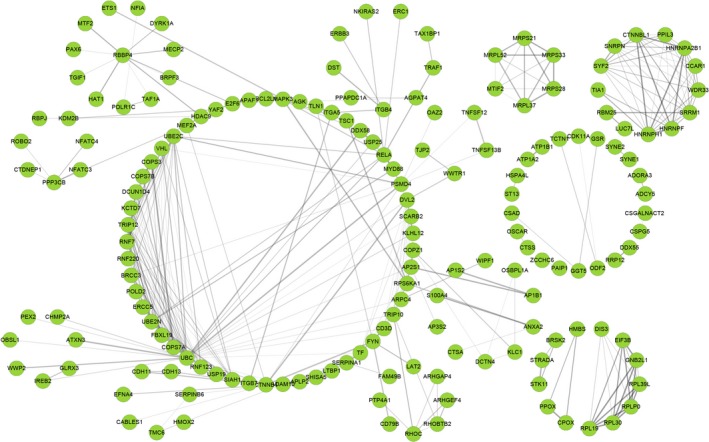
Figure 5.

The protein‐protein interactive network of gene symbols in survival‐associated alternative splicing events. Each node represents a protein coded by a gene. The edges represent the interactions, among which the thicker edges indicate a higher combined score, while the darker edges indicate a higher coexpression
