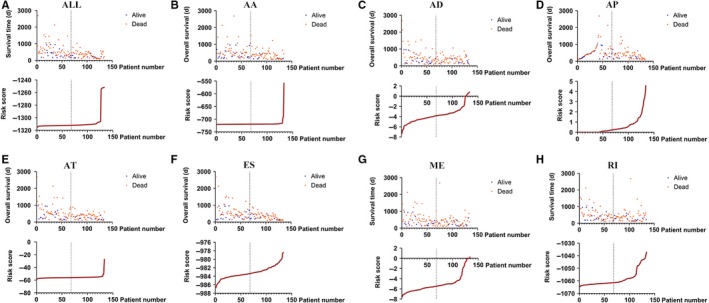
Figure 6.

The survival details of the included patients in each prognostic model. The top of each drawing shows the survival data divided into low‐/high‐risk groups according to the median value of the risk score. The bottom shows the curve of the risk score. A‐H, The seven combined alternative splicing models, Alternate Acceptor site model, Alternate Donor site model, Alternate Promoter model, Alternate Terminator model, Exon Skip model, Mutually Exclusive exons model, and Retained Intron model
