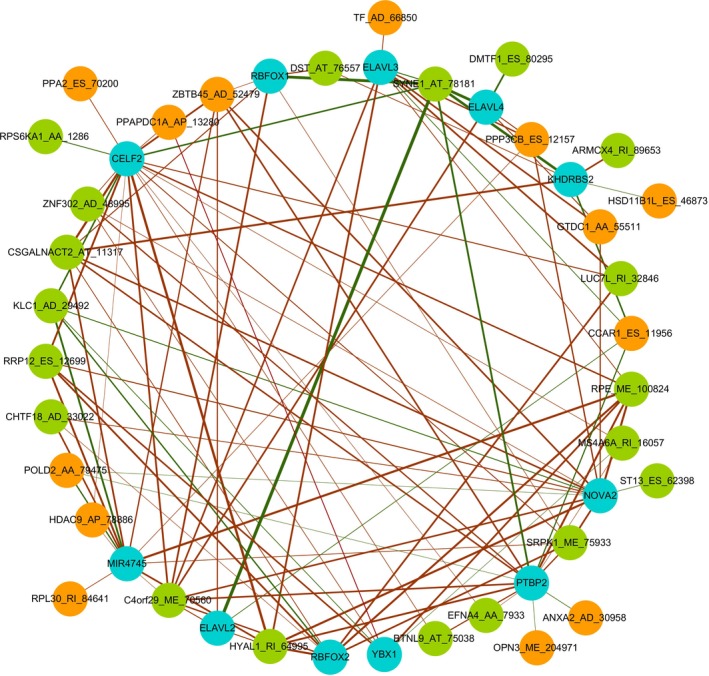
Figure 10.

The splicing regulatory network constructed using splicing factors and alternative splicing factors. The blue nodes represent differentially expressed splicing factors. The orange nodes represent the unfavorable alternative splicing events (Hazard ratio > 1), while the green nodes represent favorable alternative splicing events (Hazard ratio < 1). The red edges represent the positive correlations, while the green edges represent negative correlations. The thicker edges indicate stronger correlations
