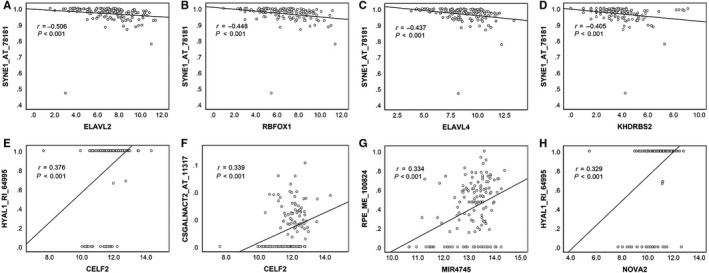
Figure 11.

A linear correlation plot displaying the strongest correlations between splicing factors and alternative splicing events. A, ELAVL2 was negatively correlated to SYNE1_AT_78181. B, RBFOX1 was negatively correlated to SYNE1_AT_78181. C, ELAVL4 was negatively correlated to SYNE1_AT_78181. D, KHDRBS2 was negatively correlated to SYNE1_AT_78181. E, CELF2 was positively correlated to HYAL1_RI_64995. F, CELF2 was positively correlated to CSGALNACT2_AT_11317. G, MIR4745 was positively correlated to RPE_ME_100824. H, NOVA2 was positively correlated to HYAL1_RI_64995
