
Figure 4.
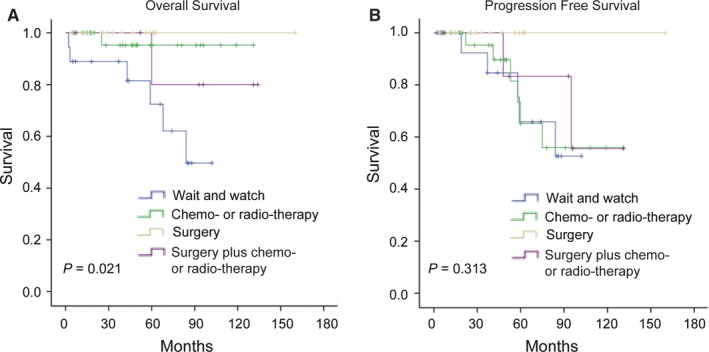
Kaplan‐Meier curves comparing overall survival (A) and progression‐free survival (B) between different treatment strategies in pulmonary MALT lymphoma patients
Official websites use .gov
A
.gov website belongs to an official
government organization in the United States.
Secure .gov websites use HTTPS
A lock (
) or https:// means you've safely
connected to the .gov website. Share sensitive
information only on official, secure websites.
Kaplan‐Meier curves comparing overall survival (A) and progression‐free survival (B) between different treatment strategies in pulmonary MALT lymphoma patients