
Figure 1. Fo5176 hyphae and elicitors cause simultaneous depletion of the cellulose synthase machinery at the plasma membrane and root growth rate reduction.
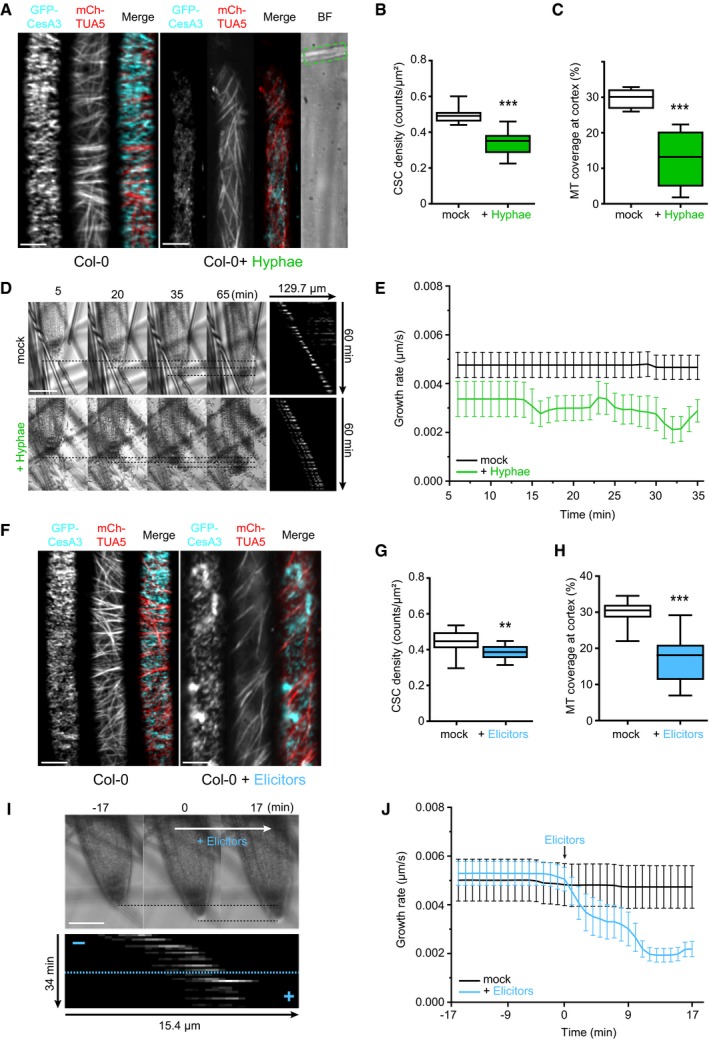
- Representative image of a 5‐day‐old WT (Col‐0) GFP‐CesA3 and mCh‐TUA5 dual‐labeled root epidermal cell under mock conditions (left panel) or upon 5 min of Fo5176 hyphae contact (right panel). A green dashed line in the brightfield (BF) channel highlights Fo5176 hypha. Scale bar = 5 μm.
- GFP‐CesA3 density at the plasma membrane after Fo5176 hyphae contact as depicted in (A). Box plots: centerlines show the medians; box limits indicate the 25th and 75th percentiles; whiskers extend to the minimum and maximum. N ≥ 25 cells from 14 roots and three independent experiments. Welch's unpaired t‐test; ***P‐value ≤ 0.001.
- Microtubule density at the cell cortex after Fo5176 hyphae contact as depicted in (A). Box plots as described in (B). N ≥ 20 cells from 8 roots and three independent experiments. Welch's unpaired t‐test; ***P‐value ≤ 0.001.
- Growth progression of roots grown in half MS or half MS + Fo5176 hyphae. Left panels: representative images of roots at different times after the corresponding treatment. Images of hyphae treatment were modified with an unsharp mask to enhance visibility of hyphae. Scale bar = 100 μm. Right panel: kymographs depicting growth of roots in the left panel.
- Growth rate of roots in half MS or half MS + Fo5176 hyphae, analyzed from images as in (D). Roots were exposed to hyphae for 5 min before imaging started. Average growth rate in half MS: 0.0047 ± 0.0005 μm/s; average growth rate in half MS + Fo5176 hyphae: 0.0031 ± 0.0005 μm/s. Values are mean ± SEM, N ≥ 11 seedlings from three independent experiments. Welch's unpaired t‐test; P‐value ≤ 0.05.
- Representative image of a 5‐day‐old WT (Col‐0) GFP‐CesA3 and mCh‐TUA5 dual‐labeled root epidermal cell under mock conditions (left panel) or upon 5‐min elicitor treatment (right panel). Scale bar = 5 μm.
- GFP‐CesA3 density at the plasma membrane after elicitor treatment as depicted in (F). Box plots as described in (B). N ≥ 35 cells from 16 roots and three independent experiments. Welch's unpaired t‐test; **P‐value ≤ 0.01.
- Microtubule density at the cell cortex, after elicitor treatment as depicted in (F). Box plots as described in (B). N ≥ 37 cells from 16 roots and three independent experiments. Welch's unpaired t‐test; ***P‐value ≤ 0.001.
- Growth progression of roots exposed to fungal elicitor mix. Upper panel: representative images of roots grown in half MS (−17 to 0 min) and after being exposed to the fungal elicitor mix added at 0 min. Scale bar = 100 μm. Lower panel: kymograph depicting growth of roots in the upper panel.
- Growth rate of roots exposed to fungal elicitors, analyzed from images as in (I). After 17 min of growth in half MS, H2O or elicitors were added and the growth rate was measured for additional 17 min. Average growth rate before treatment (−17 to 0 min): H2O: 0.0050 ± 0.0009 μm/s; elicitor mix: 0.0053 ± 0.0005 μm/s. Average growth rate after treatment (0–17 min): H2O: 0.0048 ± 0.0009 μm/s; elicitor mix: 0.0028 ± 0.0004 μm/s. Values are mean ± SEM, N ≥ 10 seedlings from three independent experiments. Welch's unpaired t‐test for roots before and after elicitor treatment; P‐value ≤ 0.01.
Source data are available online for this figure.