
Figure EV1. Fo5176 hyphae and elicitors cause an immediate speed decrease of plasma membrane localized cellulose synthase complexes.
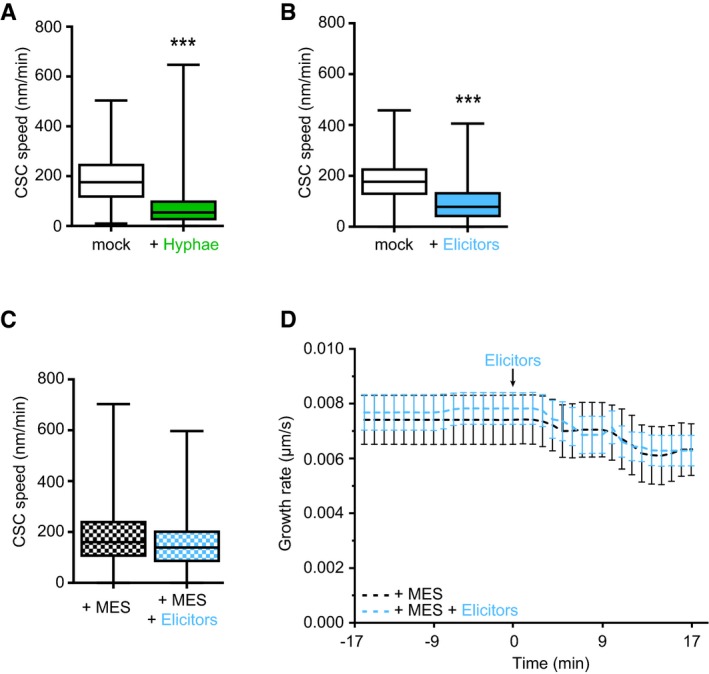
- GFP‐CesA3 speed at the plasma membrane of WT (Col‐0) root cells 5 min after half MS treatment or Fo5176 contact (as depicted in Fig 1A). Box plots: centerlines show the medians; box limits indicate the 25th and 75th percentiles; whiskers extend to the minimum and maximum. N ≥ 369 particles from 6 cells and 6 roots and three independent experiments; Welch's unpaired t‐test; ***P‐value ≤ 0.001.
- GFP‐CesA3 speed at the plasma membrane of WT (Col‐0) root cells 5 min after half MS or half MS + elicitor treatment (as depicted in Fig 1F). Box plots as described in (A). N ≥ 647 particles from 9 cells and 6 roots and three independent experiments; Welch's unpaired t‐test; ***P‐value ≤ 0.001.
- GFP‐CesA3 speed at the plasma membrane of WT (Col‐0) root cells 5 min after being exposed to half MS + 5 mM MES and half MS + 5 mM MES + elicitor treatment (as depicted in Fig 2A). Box plots as described in (A). N ≥ 786 particles from 13 cells and 11 roots and three independent experiments.
- Growth rate of WT (Col‐0) roots exposed to fungal elicitors and 5 mM MES. After 17 min of growth in half MS + 5 mM MES, H2O or elicitors were added and the growth rate was measured for an additional 17 min. Average growth rate before treatment (−17 to 0 min): 5 mM MES: 0.0074 ± 0.0009 μm/s; elicitors + 5 mM MES: 0.0068 ± 0.0010 μm/s. Average growth rate after treatment (0–17 min): 5 mM MES: 0.0077 ± 0.0024 μm/s; elicitors + 5 mM MES: 0.0069 ± 0.0020 μm/s. Values are mean ± SEM, N ≥ 11 seedlings from three independent experiments. Welch's unpaired t‐test for roots before and after elicitor treatment; P‐value = 0.33.
Source data are available online for this figure.