
Figure EV2. Fo5176‐induced depletion of the cellulose synthase machinery and acidification of the plasma membrane interface, measured with newly designed sensors, can be buffered.
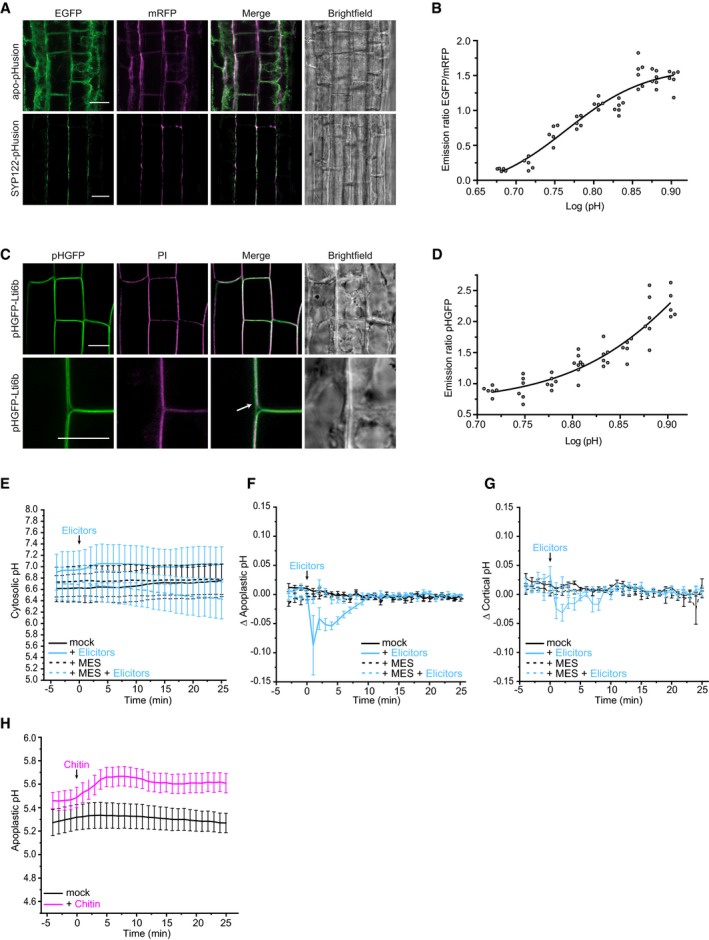
- Representative images of 6‐day‐old WT (Col‐0) root epidermal and cortex cells expressing apo‐pHusion or SYP122‐phusion. Much less intracellular signal of pHusion is observed for SYP122‐pHusion than for apo‐pHusion. Scale bar = 20 μm.
- In vivo calibration of SYP122‐pHusion in 6‐day‐old roots. Dots represent individual samples with N ≥ 5 seedlings per standard buffer. Data points were fitted using sigmoidal regression.
- Representative images of 6‐day‐old WT (Col‐0) root epidermal and cortex cells expressing pHGFP‐Lti6b. Cell walls of seedlings were counterstained with 3 μg/ml propidium iodide to illustrate plasma membrane localization of pHGFP‐Lti6b of two adjacent cells (white arrow). Scale bars = 10 μm.
- In vivo calibration of pHGFP‐Lti6b in 6‐day‐old roots. Dots represent individual samples with N ≥ 5 seedlings per standard buffer. Data points were fitted using sigmoidal regression.
- Cytoplasmic pH variation of WT roots expressing the pHcyto free pHGFP sensor over time, either in half MS or in half MS + 5 mM MES. Imaging started 5 min before either H2O or a fungal elicitor mix was added (0 min). Values are mean ± SEM, N ≥ 12 seedlings from three independent experiments. RM two‐way ANOVA on half MS + H2O versus half MS + elicitors: P = 0.42 (treatment), P = 0.06 (time), P = 0.08 (treatment × time).
- Apoplastic ∆pH of WT roots expressing the pHapo SYP122‐pHusion sensor over time, either in half MS or in half MS + 5 mM MES. Imaging started 5 min before either H2O or a fungal elicitors were added (0 min). Values are mean ± SEM, N ≥ 16 seedlings from three independent experiments. RM two‐way ANOVA on half MS + H2O versus half MS + elicitors: P ≤ 0.001 (treatment), P ≤ 0.05 (time), P ≤ 0.001 (treatment × time).
- Cortical ∆pH of WT roots expressing the pHcortical pHGFP‐Lti6b sensor over time, either in half MS or in half MS + 5 mM MES. Imaging started 5 min before either H2O or a fungal elicitor mix was added (0 min). Mixed‐effects model on half MS + H2O versus half MS + elicitors: P ≤ 0.01 (treatment), P ≤ 0.001 (time), P ≤ 0.001 (treatment × time).
- Apoplastic pH of WT roots expressing the pHapo SYP122‐pHusion sensor over time in half MS. Imaging started 5 min before either H2O (mock) or 1 mM chitin were added (0 min). Values are mean ± SEM, N = 15 seedlings from three independent experiments. RM two‐way ANOVA on half MS + H2O versus half MS + chitin: P ≤ 0.05 (treatment), P ≤ 0.001 (time), P ≤ 0.001 (treatment × time). This chitin assay was done simultaneously to the elicitor treatments (Fig 2E); therefore, they share the same mock (H2O) curve.
Source data are available online for this figure.