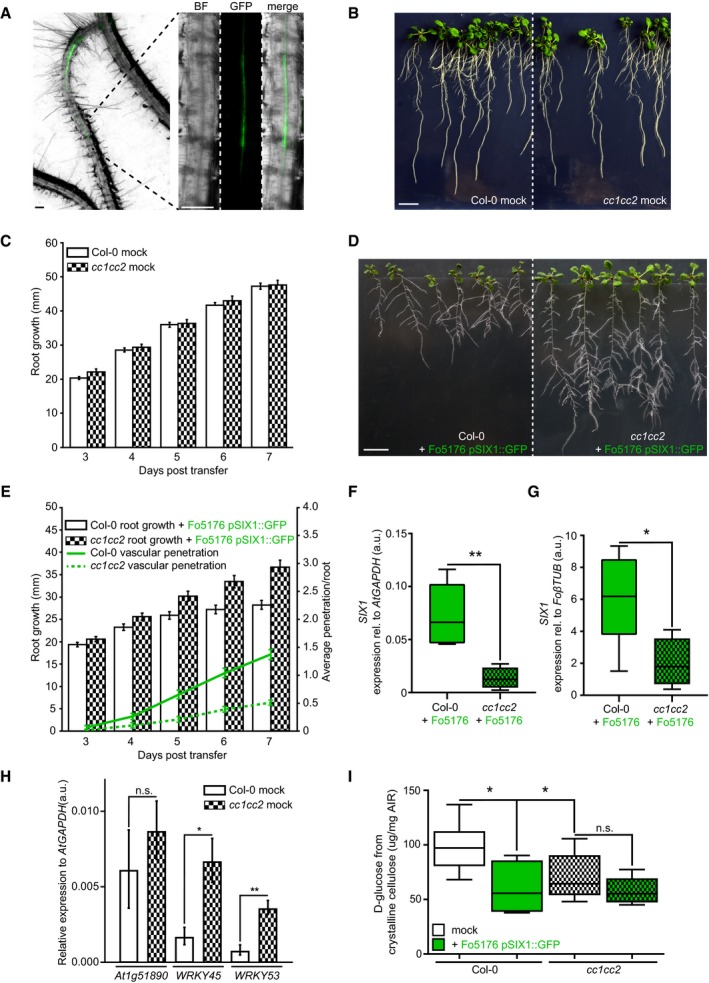
Figure 4. cc1cc2 mutants are less susceptible than wild‐type to Fo5176 vasculature colonization.

- Arabidopsis root vasculature colonized by Fo5176 pSIX1::GFP. Right panel shows a magnification separated into brightfield (BF) and GFP channel. GFP fluorescence is apparent when Fo5176 colonized the vasculature (dark gray, root central line in BF channel). Scale bars = 125 μm.
- Representative image of WT (Col‐0) and cc1cc2 plants 7 days post‐transfer to half MS mock plates. Scale bar = 10 mm.
- Root elongation of WT (Col‐0) and cc1cc2 plants at various days post‐transfer to mock plates, as depicted in (B). Values are mean ± SEM, N ≥ 103 plants from three independent experiments. RM two‐way ANOVA: P = 0.65 (genotype), P ≤ 0.001 (time), P = 0.33 (genotype × time).
- Representative image of WT (Col‐0) and cc1cc2 plants 7 days post‐transfer to Fo5176 pSIX1::GFP spore containing plates. Scale bar = 10 mm.
- Root elongation and vascular penetration of WT (Col‐0) and cc1cc2 mutant plants at various days post‐transfer to Fo5176 pSIX1::GFP spore containing plates, as depicted in (D). Values are mean ± SEM, N ≥ 103 plants from three independent experiments. RM two‐way ANOVA on root growth: P ≤ 0.001 (genotype), P ≤ 0.001 (time), P ≤ 0.01 (genotype × time). RM two‐way ANOVA on vascular penetration rate: P ≤ 0.01 (genotype), P ≤ 0.001 (time), P ≤ 0.001 (genotype × time).
- SIX1 expression relative to AtGAPDH in WT (Col‐0) or cc1cc2 roots 7 days post‐inoculation with Fo5176 spores. Box plots: centerlines show the medians; box limits indicate the 25th and 75th percentiles; whiskers extend to the minimum and maximum. N ≥ 4 biological replicates; Welch's unpaired t‐test; **P‐value ≤ 0.01.
- SIX1 expression relative to FoβTUB in WT (Col‐0) or cc1cc2 roots 7 days post‐inoculation with Fo5176. Box plots as described in (F). N ≥ 4 biological replicates; Welch's unpaired t‐test; *P‐value ≤ 0.05.
- Expression of At1g51890, WRKY45, and WRKY53 relative to AtGAPDH in WT (Col‐0) and cc1cc2 roots under mock conditions. Values are mean ± SEM, N ≥ 4 biological replicates; Welch's unpaired t‐test; *P‐value ≤ 0.05. **P value ≤ 0.01.
- Cellulose content of roots grown as depicted in (B and D), represented as μg of D‐glucose derived from crystalline cellulose per mg of dried alcohol‐insoluble residue (AIR). Box plots as described in (F). N ≥ 5 biological replicates; 2 technical replicates per biological replicate. Welch's unpaired t‐test; *P‐value ≤ 0.05, n.s. = not significant.
Source data are available online for this figure.
