
Figure EV4. cc1cc2 resistance to Fo5176 root colonization can be mimicked in wild‐type plants by buffering the growth media.
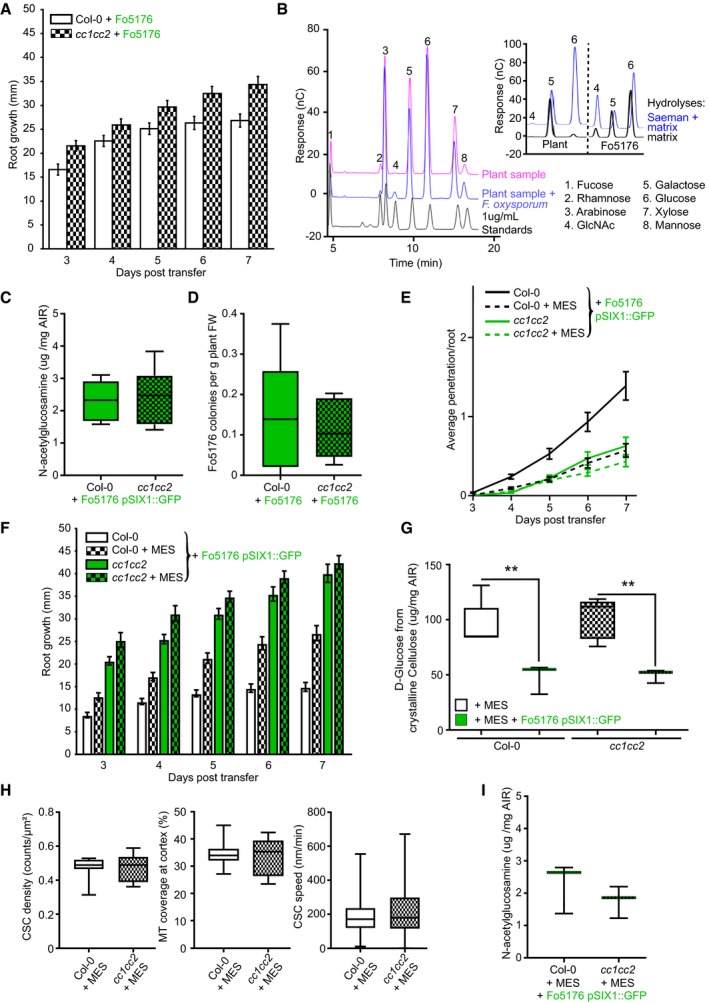
- Root elongation at various days post‐transfer to Fo5176 spore containing plates. Values are mean ± SEM, N ≥ 33 plants from three independent experiments. RM two‐way ANOVA: P ≤ 0.01 (genotype), P ≤ 0.001 (time), P ≤ 0.05 (genotype × time).
- Left panel: Monosaccharide elution profile of a 1 μg/ml standard (black) compared to 1:10 dilutions of hydrolyzed samples (Saeman hydrolysis, as indicated in methods section) derived from roots after 7 days of either mock (pink) or Fo5176 treatment (blue). The N‐acetylglucosamine (GlcNAc) peak (4) is only identifiable in hydrolyzed infected samples (blue). Right panel: Strong and weak hydrolyses of fungal‐derived cell wall material indicate negligible presence of glucose non‐extractable with the matrix hydrolysis method, as the glucose peak is similar in either hydrolysis method. In plants, there is a clear difference between the glucose peaks in either hydrolysis method.
- Quantification of the N‐acetylglucosamine peak of Fo5176 pSix1::GFP‐infected roots derived from the fungal cell wall as shown in (B). Box plots: centerlines show the medians; box limits indicate the 25th and 75th percentiles; whiskers extend to the minimum and maximum. N ≥ 5 biological replicates; Welch's unpaired t‐test; P = 0.34.
- Quantification of Fo5176 colonies developing after surface sterilization of infected roots. Box plots as described in (C). N = 5 biological replicates; Welch's unpaired t‐test; P = 0.75.
- Vascular penetration of WT (Col‐0) and cc1cc2 plants at various days post‐inoculation with Fo5176 pSIX1::GFP spores with or without 5 mM MES. Values are mean ± SEM, N ≥ 33 plants from three independent experiments. RM two‐way ANOVA (Col‐0 half MS versus Col‐0 half ME + MES): P ≤ 0.001 (genotype), P ≤ 0.001 (time), P ≤ 0.001 (genotype × time).
- Root elongation of WT (Col‐0) and cc1cc2 plants at various days post‐inoculation with Fo5176 pSIX1::GFP spores with or without 5 mM MES. Values are mean ± SEM, N ≥ 33 plants from three independent experiments. RM two‐way ANOVA (Col‐0 half MS versus Col‐0 half MS + MES): P ≤ 0.001 (genotype), P ≤ 0.001 (time), P ≤ 0.001 (genotype × time).
- Cellulose content of roots 7 days post‐transfer to Fo5176 pSIX1::GFP spore containing half MS + 5 mM MES plates or post‐transfer to control (half MS +5 mM MES) plates, represented as μg of D‐glucose derived from crystalline cellulose per mg of dried alcohol‐insoluble residue (AIR). Box plots as described in (C). N ≥ 5 biological replicates; 2 technical replicates per biological replicate. Welch's unpaired t‐test; **P‐value ≤ 0.01.
- CSC (N ≥ 27 cells from 11 roots) and microtubule (N ≥ 17 cells from 7 roots) density and CSC speed (N ≥ 366 particles from 17 cells and 9 roots) at the plasma membrane of WT (Col‐0) or cc1cc2 root cells expressing YFP‐CesA6 and mCh‐TUA5 grown on half MS + 5 mM MES. Data are from three independent experiments. Box plots as described in (C). Welch's unpaired t‐test indicates no significant difference for all measurements.
- Quantification of the N‐acetylglucosamine peak of Fo5176 infected plants grown on half MS + 5 mM MES derived from the fungal cell wall as shown in (B). Box plots as described in (C). N = 3 biological replicates; Welch's unpaired t‐test; P = 0.41.
Source data are available online for this figure.