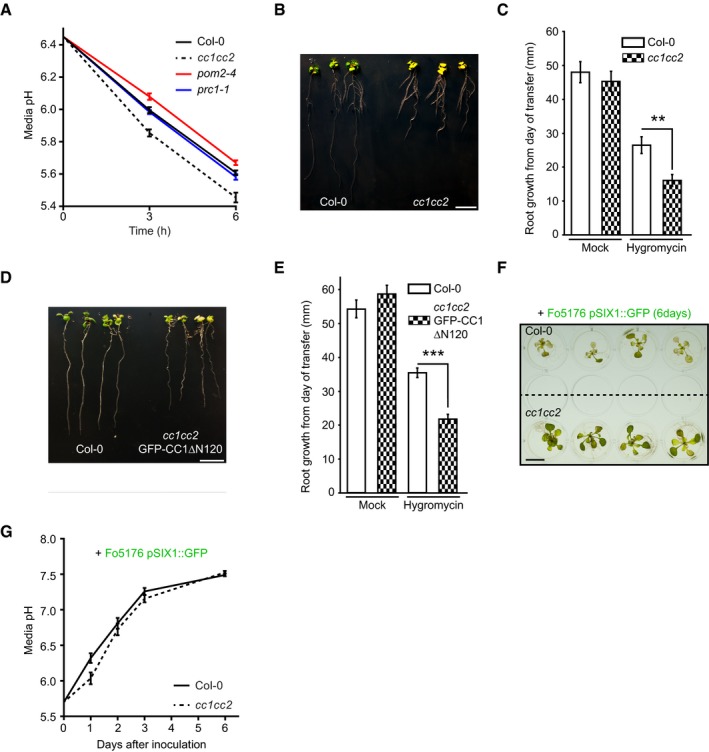
Figure EV5. cc1cc2 mutants rapidly acidify the media, are hypersensitive to hygromycin B, and show a delay of Fo5176‐induced media alkalinization.

- Media pH development over time when 10‐day‐old WT (Col‐0), cc1cc2, pom2‐4, and prc1‐1 plants were transferred to a liquid, alkaline media (pH 6.45). Values are mean ± SEM, N ≥ 17 plants from three independent experiments. Welch's unpaired t‐test versus Col‐0 at 6 h: cc1cc2 P‐value ≤ 0.001; pom2‐4 P‐value ≤ 0.01; prc1‐1 P‐value = 0.29.
- Representative image of WT (Col‐0) and cc1cc2 plants 7 days post‐transfer to half MS + 5 μg/ml hygromycin B plates. Scale bar = 10 mm.
- Root growth of plants grown as in (B). Values are mean ± SEM, N ≥ 15 plants from three independent experiments. Welch's unpaired t‐test; **P‐value ≤ 0.01.
- Representative image of WT (Col‐0) and cc1cc2 GFP‐CC1ΔN120 plants 7 days post‐transfer to half MS + 5 μg/ml hygromycin B plates. Scale bar = 10 mm.
- Root growth of plants grown as in (D). Values are mean ± SEM, N ≥ 16 plants from three independent experiments. Welch's unpaired t‐test; ***P‐value ≤ 0.001.
- Representative image of WT (Col‐0) and cc1cc2 plants 7 days post‐inoculation with Fo5176 pSIX1::GFP spores in liquid half MS media. Scale bar = 10 mm.
- Media pH development of an experiment as depicted in (F). Values are mean ± SEM, N = 36 plants from three independent experiments. RM two‐way ANOVA: P = 0.069 (genotype), P ≤ 0.001 (time), P ≤ 0.05 (genotype × time).
Source data are available online for this figure.
