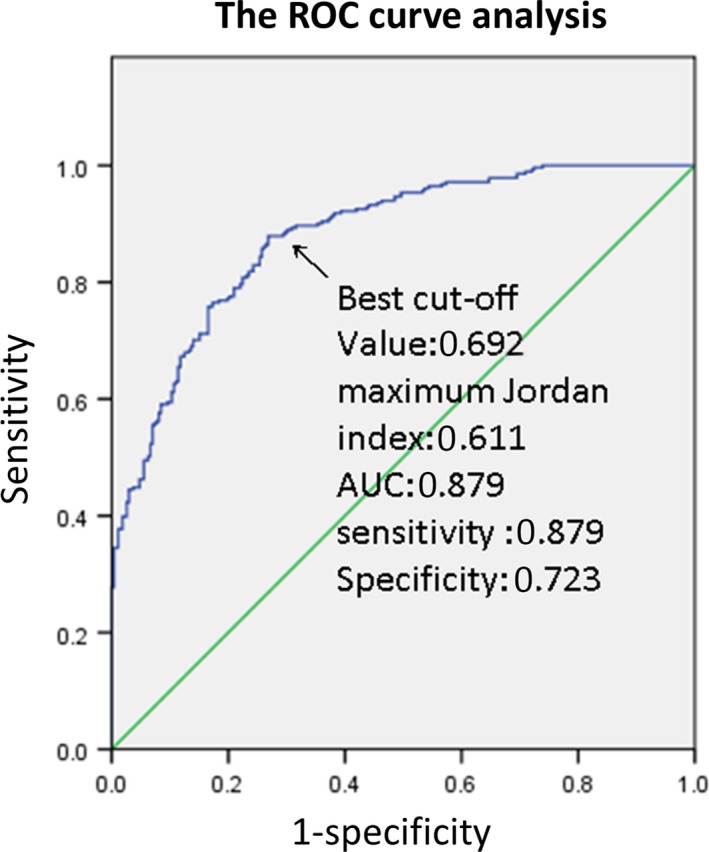
Figure 3.

The ROC curve of the UGSR for distinguishing PTCs and NGs in subgroups of different tumor sizes. ROC, receiver operating characteristic; UGSR, ultrasound gray scale ratio; PTCs, papillary thyroid carcinomas; NGs, nodular goiters

The ROC curve of the UGSR for distinguishing PTCs and NGs in subgroups of different tumor sizes. ROC, receiver operating characteristic; UGSR, ultrasound gray scale ratio; PTCs, papillary thyroid carcinomas; NGs, nodular goiters