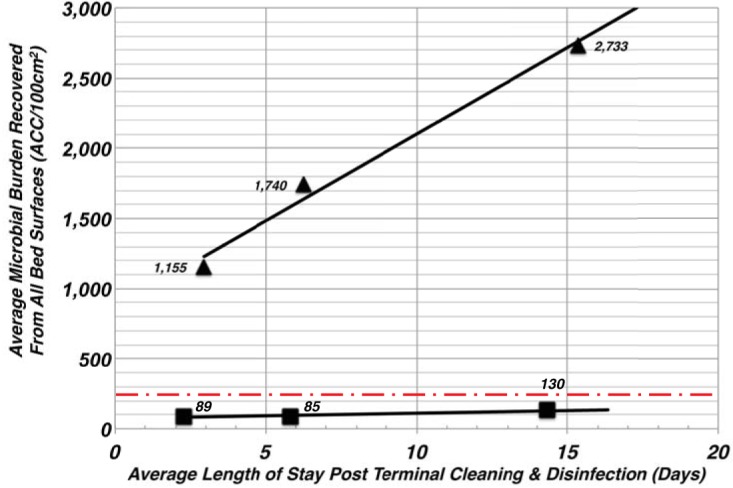
FIG 3.

The microbial burden affiliated with the patient bed is dependent on length of stay. The microbial burdens affiliated with each bed area were separated into one of three categories based on the LOS of the patient. The efficiency with which interventional bed surfaces were able to control the microbial burden was assessed against the values from the control beds using pairwise comparisons using the Mann-Whitney test with a significance level (P) assessed as less than 5% (P < 0.05) using Prism 8 software. The number of patients considered in the analysis was 70 for the control and 43 for the interventional beds. The values comparing control to interventional groups were found to be all significant at P < 0.0001, as were the first two control values to the third grouping (>10 days); for the <5 days to >10 days grouping, the P value was 0.0003. Solid triangles represent the average microbial burden for control beds, and the filled squares represent that for the interventional or copper-encapsulated beds. The red dashed line denotes the discharge/terminal cleaning & disinfection (TC&D) risk threshold target of less than 250 ACC/100 cm2.
