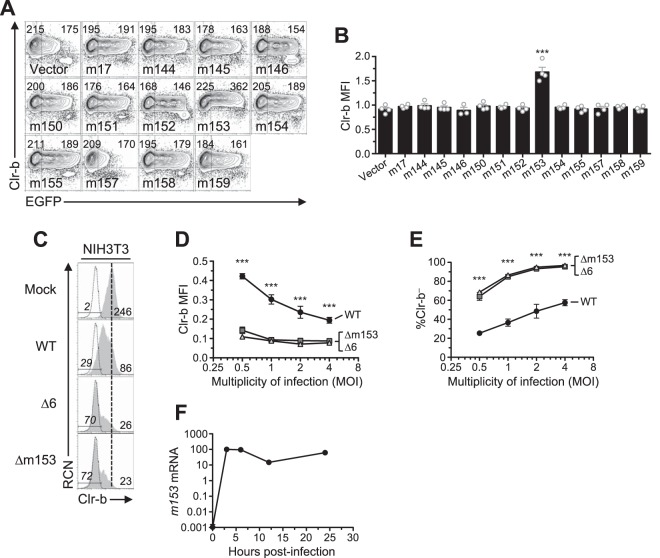
FIG 3.
Expression of m153 in mouse cells increases cell surface Clr-b. (A) NIH 3T3 cells were transfected with cDNA encoding the m145 family and analyzed for Clr-b cell surface expression 48 h posttransfection. Numbers on the left and right represent MFI values of GFP– and GFP+ gated populations, respectively. (B) Quantitation of normalized cell surface Clr-b expression in panel A (GFP+/GFP–). Data were analyzed using 1-way ANOVA and are representative of those from 3 independent experiments. (C to E) NIH 3T3 cells were infected with MCMV viruses (WT, Δ6, or Δm153) at different MOI and assessed for cell surface Clr-b expression by flow cytometry 24 hpi. (C) Histograms showing Clr-b expression at the different MOI. (D) Quantitation of normalized Clr-b MFI. (E) Quantitation of % Clr-b– cells. Data were analyzed using 2-way ANOVA and are representative of those from 3 independent experiments. (F) Transcript levels of m153 measured during time course of MCMV infection. All data are representative of those from 3 or 4 independent experiments.

