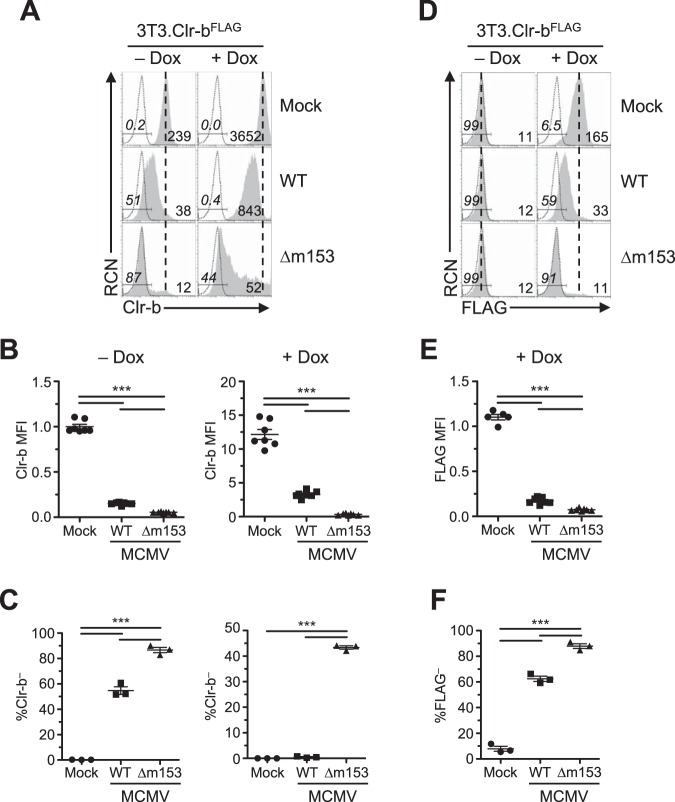
FIG 9.
Prominent Clr-b loss in cells overexpressing Clr-b when infected with MCMV lacking m153. NIH 3T3.Clr-b fibroblasts were cultured in the absence or presence of Dox and infected with either WT or Δm153 MCMV virus and analyzed using flow cytometry 24 hpi. (A) Clr-b cell surface expression measured by anti-Clr-b (4A6 MAb). The vertical dotted line symbolizes mock MFI, whereas numbers on the left represent the percent Clr-b– cells in the gate and numbers on the right represent MFI values. (B) Quantitation of Clr-b MFI in panel A, normalized to Clr-b levels on resting uninduced cells. (C) Measurements of percent Clr-b– cells with different viruses in panel A. (D) Clr-b cell surface expression measured by anti-FLAG (M2 MAb). (E) Quantitation of Clr-b MFI in panel D. (F) Measurements of percent Clr-b– cells with different viruses in panel D. Data were analyzed using 1-way ANOVA and are representative of those from 3 to 6 independent experiments.

